

Die Casting Process Monitoring: What to Measure, How Fast, and What to Do When It Moves
A die casting machine produces a complete record of every shot and most shops look at none of it. The parameters that decide whether a casting is sound are set once during sampling, written on a setup card, and then trusted until a customer complains. Six months later nobody can say what changed, because nothing was recorded.
This article is a practical specification for die casting process monitoring: which variables matter, at what sampling rate, how to set control limits from capability data rather than from opinion, how to build an alarm philosophy operators will not disable, how to trace a defect back to a shot, a ladle and a cavity, and what a shop with no instrumentation should buy first.
Why monitor: the shot curve knows before the part does
Porosity, cold flow, misruns and die-soldering are all caused by conditions that exist for a few hundred milliseconds inside the die. X-ray and pressure testing find them after the fact, and only if you test every part. The shot profile shows the cause in real time, on every shot.
Three practical benefits:
- Detection. A shot that filled with an entrained air wave is identifiable from the velocity and pressure trace, so you can segregate one shot instead of quarantining a shift.
- Diagnosis. When scrap appears, the data tells you whether the machine, the die, the metal or the operator moved. Without it, every scrap meeting is an argument.
- Evidence. Capability data from the actual production window is the strongest position you can hold in a customer complaint or a PPAP submission.
The variables worth monitoring
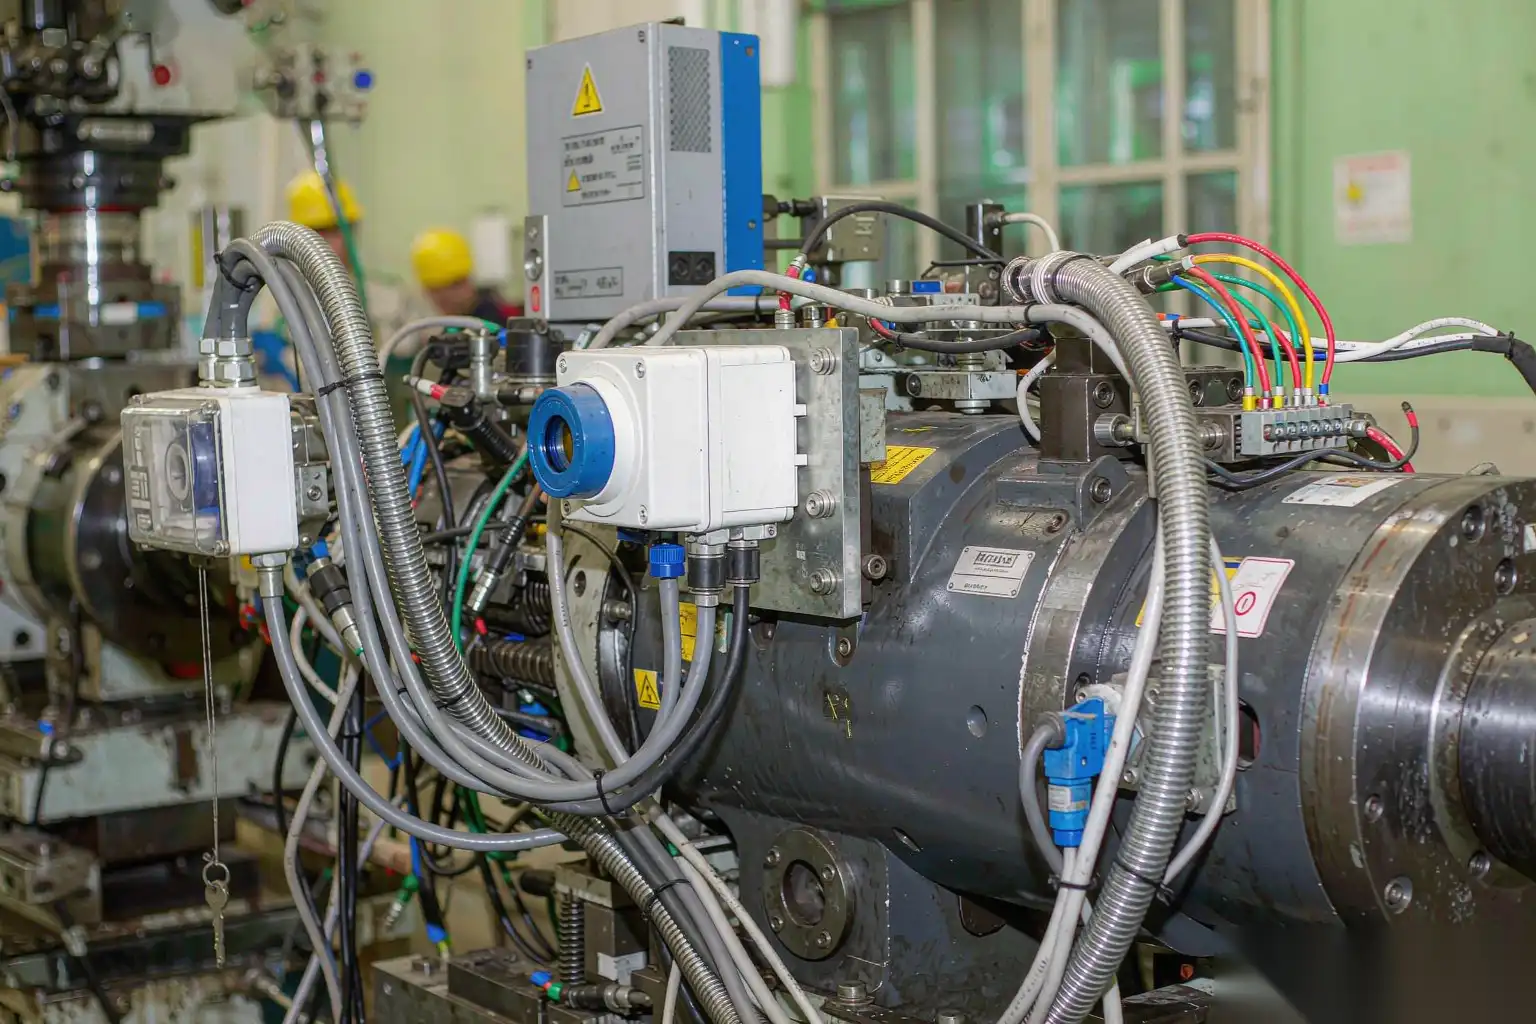
Not everything deserves a sensor. The list below is the set that correlates with the defects that actually cost money.
Shot profile: slow shot velocity and fill fraction
Slow shot velocity controls air entrainment in the shot sleeve. Too slow and the metal chills and forms a wave that folds air into the charge; too fast and the metal itself breaks into a wave. For aluminium in sleeves of 50-100 mm, the window is usually 0.20-0.50 m/s, and the target slow shot velocity depends on sleeve diameter and fill fraction. Fill fraction, the ratio of poured metal volume to sleeve volume, should sit between about 35 and 55 percent; below 30 percent you are almost guaranteeing wave formation and air entrainment regardless of velocity.
Monitor: actual plunger velocity in the slow phase, calculated from position feedback, with a resolution of at least 0.01 m/s. Log it every shot.
Switch point and fast shot velocity
The switch from slow to fast shot is the most sensitive single set-point on the machine. A switch point that drifts 10 mm changes cavity fill behaviour and gas evacuation dramatically. Good machines hold the switch point within ±2-3 mm; a machine drifting beyond ±5 mm needs attention to the position transducer or the hydraulic valve.
Fast shot (gate) velocity for thin-wall aluminium parts typically runs 30-60 m/s at the gate, and the plunger velocity required depends on the projected area and gate cross-section. Monitor peak plunger velocity and the velocity at switch.
Intensification pressure and build-up time
Intensification is what feeds shrinkage during solidification. Two numbers matter:
- Peak metal pressure, typically 40-100 MPa for aluminium depending on wall thickness and quality class.
- Intensification build-up time, the interval from the end of cavity fill to reaching a defined fraction of peak pressure. On a well-maintained machine this is 20-40 ms; above 60-80 ms the gate is already freezing and you are feeding solid metal, which shows up as shrinkage porosity in thick sections.
Monitor peak pressure and the time to reach 90 percent of peak. Both drift with accumulator nitrogen pre-charge, oil temperature and valve response, which is exactly why they need to be recorded rather than assumed.
Die temperature zones
Die surface temperature governs fill, surface finish and die life. Typical steady-state ranges: 180-250 C for aluminium alloys such as AlSi9Cu3 and ADC12, 150-200 C for zinc. What matters as much as the absolute value is the spread: a difference of more than about 30 C between zones of the same die produces hot spots that solder, cold spots that misrun, and a moving pattern of both as the die warms.
Install thermocouples 1-3 mm behind the cavity surface, at a minimum of four points: near the gate, at the far end of the cavity, on one thick section, and on one slider if the die has one. Additional channels on water-cooled circuits are worth it on high-volume dies.
Cycle time and its sub-intervals
Total cycle time is a lazy metric. Break it down: close, lock, shot, dwell, open, eject, extract, spray, blow-off. Each sub-interval has its own failure signature. A dwell that lengthens by 1.5 s with no set-point change means the intensification circuit is not holding; a spray time that drifts upward usually means partially blocked nozzles; a rising open time means ejector or tie-bar wear.
Lube and vacuum
- Vacuum. Record the vacuum level achieved at the end of evacuation, in mbar absolute, and the time to reach it. A well-sealed die with a properly sized valve reaches 50-100 mbar absolute in roughly 100-250 ms. A level above about 200 mbar means a leak: worn seals, a damaged parting line, a blocked filter or a valve closing late.
- Lubricant. Record dilution ratio, spray duration per zone, and, where the sprayer supports it, the delivered volume per shot. Common dilution for water-based die release is 1:60 to 1:150; spray time 1-5 s per cycle. Under-lubrication causes soldering and ejector pin breakage; over-lubrication causes gas porosity, staining and a dirty die.
Sampling rates and resolution
Sampling rate is where most monitoring systems are under-specified. The entire cavity fill event lasts 30-150 ms. If you sample at 100 Hz you get three to fifteen points across the most important event in the cycle, which is useless.
| Variable | Minimum rate | Recommended rate | Resolution target |
|---|---|---|---|
| Plunger position / velocity | 500 Hz | 1-2 kHz | 0.1 mm / 0.01 m/s |
| Injection and intensification pressure | 500 Hz | 1-2 kHz | 0.5 MPa |
| Cavity pressure (if fitted) | 2 kHz | 5-10 kHz | 0.5 MPa |
| Die temperature | 0.2 Hz | 0.5-1 Hz | 1 C |
| Vacuum level | 10 Hz | 50-100 Hz | 5 mbar |
| Cycle sub-intervals | per shot | per shot | 0.1 s |
| Melt / holding furnace temperature | per shot | per shot | 2 C |
Store the full curve for a defined window rather than only the peak values. A 1-second trace at 1 kHz is 1,000 points per channel; four channels per shot at 500 shots per day is about 2 MB per day per machine, which is nothing. Retain full curves for 30-90 days and per-shot summary statistics indefinitely.
Setting control limits from capability data
Limits set by guessing are either ignored or wrong. The correct sequence:
- Fix the process first. Run the machine at a stable set-point for at least one full production run after warm-up. Discard warm-up shots; the first 20-40 shots after a cold start or a die change are not representative.
- Collect 25-35 subgroups of 5 consecutive shots for each monitored variable. That gives 125-175 observations, which is enough for a defensible estimate of short-term variation.
- Calculate X-bar and R limits. Trial control limits at ±3 sigma of the subgroup mean, and check for out-of-control points. Investigate and remove assignable causes, then recalculate. Do not simply delete inconvenient points.
- Compare the spread to the tolerance. Compute Ppk and Cpk. For a variable that affects a customer requirement, require Cpk of at least 1.33, and 1.67 for safety or pressure-boundary features. If Cpk is below 1.0 on shot velocity or peak pressure, the machine or the die needs work before you write any limits at all.
- Set warning limits at ±2 sigma and action limits at ±3 sigma. Apply standard run rules: one point beyond 3 sigma, seven points on one side of the mean, six points trending in one direction.
- Re-baseline on any significant change: die repair, new alloy batch, sleeve replacement, accumulator service, or a change in part revision.
An important discipline: limits belong to the machine and die combination, not to the part number office. Store them with the die ID and the shot count at which they were established, and review them at least every six months against actual scrap data. A limit that has never triggered in a year while scrap runs at 2 percent is a limit set too wide.
Alarm philosophy and operator response
Alarms that cry wolf get switched off. Every plant we visit has at least one monitoring system with its limits widened to the point of uselessness, usually within six months of installation.
Design the response first:
- Advisory (warning limit exceeded): displayed on the operator screen, logged, no machine action. Operator notes the shot number. Used for trends and single-point excursions.
- Hold part (action limit exceeded on a quality-critical variable): the shot is flagged, the part is routed to a quarantine bin automatically or by a light, and production continues. This is the workhorse level.
- Stop machine (two consecutive action-limit excursions, or any safety or equipment-limit breach): the machine stops and requires a supervisor reset with a reason code.
Rules that keep the system alive:
- Fewer than about 10 alarm types per machine, each with a written response of no more than three steps.
- Reason codes on every reset. The reason code table is where the real learning is; after three months you will know your top three causes and can fix them permanently.
- No silent widening of limits. Widening requires a documented engineering decision with a capability study attached.
- The alarm must be visible where the operator works, not only in the supervisor’s office.
- Review alarm counts weekly. A healthy cell with well-set limits produces a handful of advisory alarms per shift and very few action alarms.
Traceability by shot, ladle and cavity
When a customer finds porosity in a machined bore, the question is not “what is the defect” but “which other parts came from the same conditions”. Build the record so that question has an answer.
Minimum traceability chain per shot:
- Machine ID, die ID, and cumulative shot count on that die since the last preventive maintenance.
- Timestamp to one second, plus the shift and operator ID.
- Melt or ladle batch ID, holding furnace temperature, and the degassing or rotary treatment record for aluminium.
- Cavity ID, for multi-cavity dies and for family tools. Stamp or laser-mark the cavity number on the casting; a two-character mark costs nothing and saves entire shipments.
- The full monitored data set for the shot, or at minimum the summary statistics and a pass/fail flag.
- Downstream link: heat lot, CNC work order, finishing cell, and final pack or carton ID.
With that chain, a single confirmed defect lets you pull the exact shot trace, see whether that shot was an outlier, identify the contiguous run of shots with similar conditions, and quarantine a precise range instead of a whole week. Without it, the default is to quarantine everything, and the default is very expensive.
Data retention, PPAP and complaint investigation
Retention rules by use:
- Full shot curves: 30-90 days online, then archive. You will rarely need them beyond a month; when you do, it is for a specific incident and you know the date.
- Per-shot summary statistics: minimum two years, five for automotive, fifteen where a safety part and the contract require it. Storage cost per machine per year is trivial with modern databases.
- Capability studies and control limit revisions: retain for the life of the part plus the product liability period.
- Die maintenance and shot-count history: permanent, tied to the die ID.
For PPAP or a first article submission, the monitoring data lets you present real process capability rather than a 30-piece sample taken under ideal conditions. A level 3 submission with 125 subgroup observations of shot velocity, peak pressure and die temperature, plus Cpk values and the control chart, answers most customer engineering questions before they are asked.
For complaint investigation, the useful sequence is: identify the parts, pull the cavity and shot range, retrieve the traces, and look for excursions, trends or a change point in the days before the defect. Look specifically at the run-up to die maintenance and the run-up to a melt batch change, because those two boundaries generate most field escapes.
Minimal instrumentation list for a shop starting from nothing
You do not need a full system on day one. This is the sequence we recommend, ordered by value per currency unit.
Phase 1, the essentials:
- Shot monitoring system on the injection axis: plunger position (or a velocity transducer) at 1 kHz, injection and intensification pressure at 1 kHz, per-shot storage, alarm outputs. This is the single highest-value item.
- Four die thermocouples with a data logger, plus a handheld surface probe for verification.
- Cycle time and sub-interval logging from the machine PLC, if the machine supports it.
- Melt and holding furnace temperature logging, per shot or per 15 minutes.
- A disciplined shot counter and die maintenance log, paper is acceptable, that records cumulative shots per die and every service event.
Phase 2, once phase 1 is working and limits are set:
- Vacuum level transducer with per-shot recording.
- Cavity pressure transducers on the one or two dies causing the most pain. This is the most informative measurement available and also the most expensive per die.
- Automated lubricant delivery measurement.
- Integration of the monitoring database with the CNC and finishing cell records so the traceability chain is continuous.
Phase 3:
- Statistical process control across multiple machines on a single dashboard, automated quarantine logic, and customer-facing reporting.
A realistic phase 1 budget per machine is a fraction of the cost of one month of external scrap on a cell running at 2 percent reject. The failure mode to avoid is buying a sophisticated system and never setting the limits from capability data; a cheap system with good limits outperforms an expensive system with default ones.
For the defect mechanisms these measurements are meant to detect, aluminium die casting porosity causes and solutions is the natural companion, and high pressure aluminium die casting covers where these parameters come from in the first place.
Commissioning checklist and the failure modes to avoid
The most common ways these systems fail have nothing to do with the hardware:
- Limits copied from a setup card. The card says intensification 700 bar, so someone sets the limit at 650. The machine has never actually reached 700 in production. Limits must come from data.
- Warm-up shots included in the baseline. The first 20-40 shots after start-up belong in a separate group.
- Sensors never calibrated. A pressure transducer that drifts 3 percent per year quietly shifts your whole process. Calibrate annually and log it.
- Alarms disabled at the terminal. If operators turn alarms off to keep running, the alarm design is wrong, not the operators.
- Data collected and never reviewed. Schedule a 20 minute weekly review of the top three out-of-control variables and the reason code table. The review is the product, not the database.
With those in mind, the commissioning checklist is:
- Sampling rates verified per channel, with a test trace captured and inspected.
- 25-35 subgroups of five shots collected after warm-up, per variable, per die.
- Trial limits calculated, assignable causes removed, limits recalculated and documented.
- Cpk calculated for every variable tied to a customer requirement, target 1.33 minimum.
- Alarm tiers defined with a written three-step response and reason codes.
- Traceability fields confirmed end to end: machine, die, shot, ladle, cavity, downstream operation, pack ID.
- Retention policy set and storage verified by an actual retrieval test.
- Operator and supervisor training completed, with the weekly review scheduled in someone’s calendar.
There is one more reason to instrument the casting cell: the finishing stage has to live with whatever variation you record.
Process data is only useful if the downstream operations can absorb the variation it reports. DZ Machinery builds robotic deburring, grinding and polishing cells with force-controlled floating spindles and fixtures designed around casting variation, so a shift in gate vestige or parting flash from the casting cell does not turn into scrap at the finishing stage. We also size the cell, station count and cycle time against your actual production data rather than an ideal part. If you are planning a finishing line for die cast housings, zinc faucet bodies or hardware components, send us the drawings, the alloy, the burr condition off the trim die and your annual volume, and our engineering team will come back with a cell concept, cycle time and yield estimate you can check against your own numbers.