


Aluminum Die Casting Quality Control: An Inspection Plan from Ingot to PPAP
A die casting quality system fails in a predictable way. Someone finds a leak at final assembly, the supplier is asked for a corrective action, and the answer comes back as a sentence: “operator error, retrained.” Nothing measurable changes, and the problem returns in six weeks. The reason is usually that the plant never had a control plan that tied a characteristic to a method, a frequency and a reaction rule. It had inspectors and gauges, which is not the same thing.
This walkthrough sets out the inspection plan we recommend a buyer require and a supplier run, stage by stage: incoming alloy certification, melt control, first article layout, in-process SPC, porosity sampling, leak testing, gauge strategy, and the handling of nonconformances. Numbers are given as starting windows; tighten them where the consequence of failure is high.
Start with the control plan, not the gauge list
The control plan is a single table that follows the part from furnace to pack. Every line answers four questions: what is controlled, how it is measured, how often, and what happens when it moves. If a characteristic has no line in the table, it is not controlled, regardless of how many inspectors are on the floor.
A workable template:
| Stage | Characteristic | Spec / tolerance | Method | Sample size & frequency | Control method | Reaction rule |
|---|---|---|---|---|---|---|
| Incoming | Alloy chemistry | Per spec, e.g. Si 7.5-9.5%, Cu 3.0-4.0% | Spectrometer, 2 burns per heat | Every heat | Supplier cert + verify 1 in 10 heats | Quarantine heat, re-certify |
| Melting | Melt temperature | 660-710 °C at dosing | Calibrated immersion thermocouple | Every 2 h | Log sheet + SPC chart | Adjust, hold castings back 1 batch |
| Melting | Hydrogen / density index | DI ≤ 3% (or ≤ 2% for leak-critical) | Reduced pressure test | Every 4 h, and after any alloy change | Trend chart | Degas 15-20 min, re-test |
| Casting | Slow shot velocity | Per process window | Machine readout | Every shot | Auto alarm, ±10% | Stop, adjust |
| Casting | Intensification pressure | Per process window | Machine readout / transducer | Every shot | Auto alarm, ±10% | Stop, adjust |
| Casting | Die surface temperature | 180-250 °C typical | Contact pyrometer or IR | Start of shift, per cavity | Log | Adjust cooling / cycle |
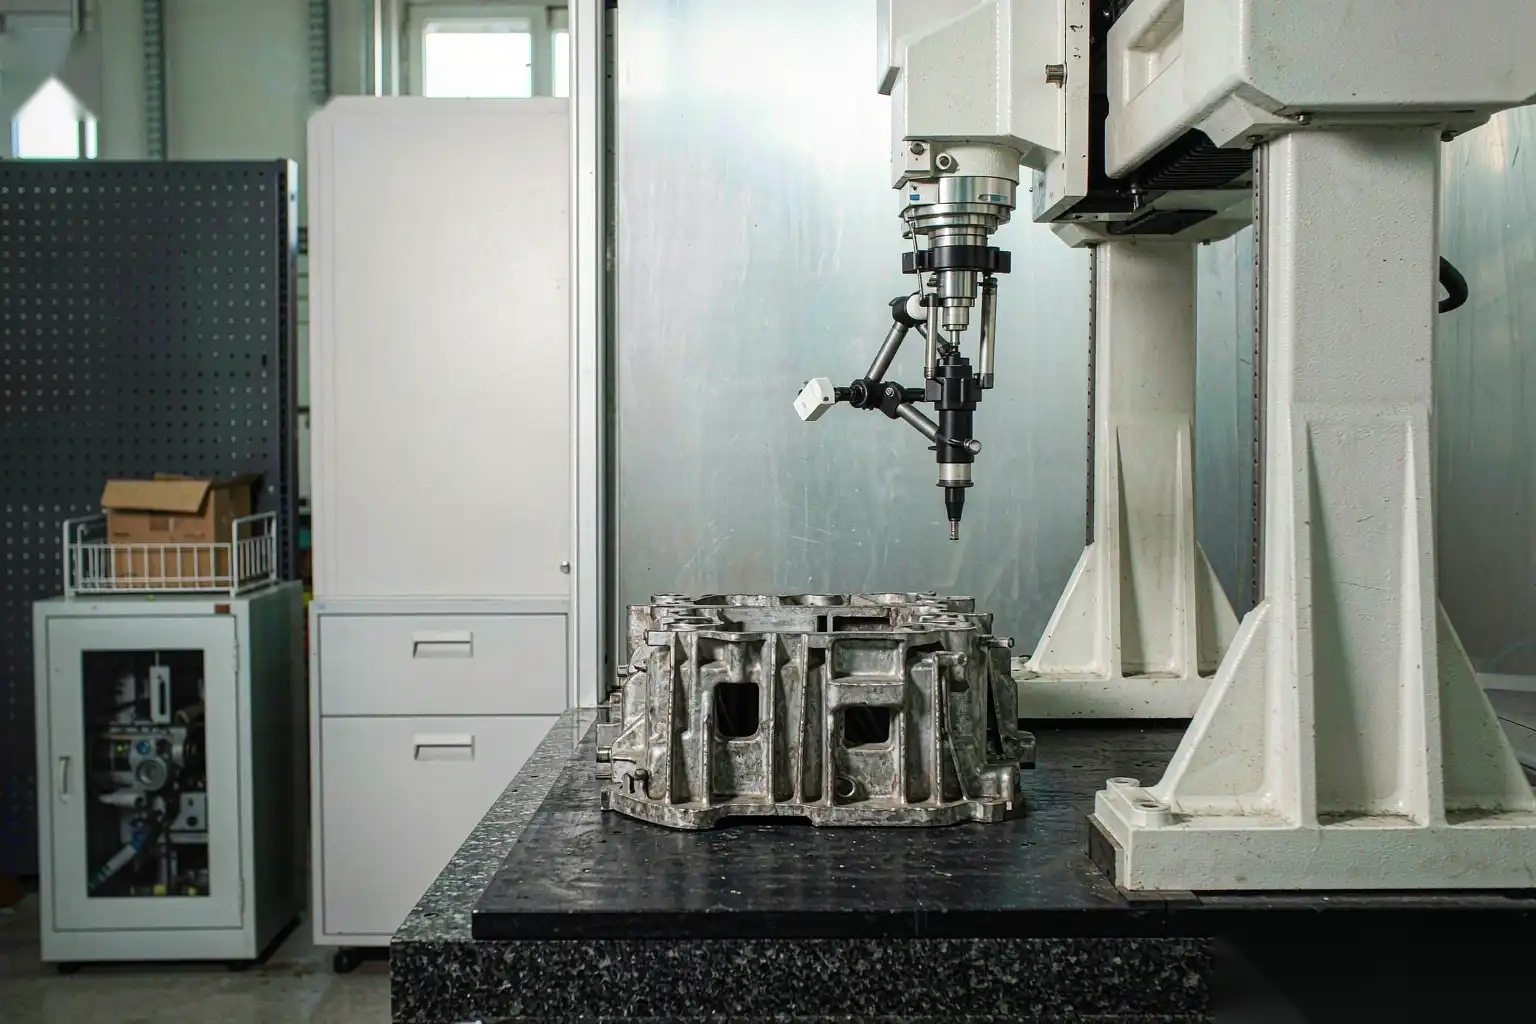
| First piece | Full dimensional layout | Drawing, all dimensions | CMM | 1 per cavity per setup | Full record | No run until released |
| In-process | Key characteristic A | e.g. 42.00 ± 0.10 | CMM or functional gauge | 5 pcs / 2 h per cavity | X-bar R chart, Cpk ≥ 1.33 | Contain, adjust, re-verify |
| In-process | Cosmetic surface | Limit sample | Visual, defined lighting 800-1000 lux | 1 per hour | Limit sample set | Stop, polish die or review |
| Post-cast | Internal porosity | Level per zone | X-ray, ASTM E505 reference | AQL 1.0 on critical zone | Trend counts | Contain lot, review process |
| Post-cast | Leak tightness | ≤ stated decay rate | Pressure decay | 100% or AQL 2.5 | Pass/fail log | Contain, 100% sort |
| Final | Packaging / labelling | Per pack spec | Visual | Each pack | Checklist | Re-pack |
Two rules make this table work. First, the reaction rule must be written as an action with an owner, not as “investigate.” Second, the control method column should name the chart type, because a Cpk calculated from 20 pieces gathered at the end of a month is not process control.
Incoming alloy and melt control
Die castings inherit their variability from the melt. Most dimensional and leak problems we trace back through cell data start as a melt problem two stages upstream.
What to require on incoming material:
- Certified chemistry per heat, with a spectrometer report, not a generic mill cert. For A380-class material the practical elements to watch are silicon (7.5-9.5%), copper (3.0-4.0%), iron (typically ≤ 1.3%, and kept high enough, around 0.8-1.1%, to reduce soldering in the die), zinc (≤ 3.0%), magnesium (≤ 0.10%), and manganese (≤ 0.50%).
- Verification testing at your supplier’s receiving dock. A full certification review on every heat plus a spectrometer check on one heat in ten, or one in five for a new ingot source.
- Returns and gate scrap discipline. Recycled material must be segregated by alloy and tracked. Uncontrolled mixing of returned runners from a different alloy family is the fastest route to a chemistry failure.
- Ingot storage. Dry, covered, and brought to shop temperature before charging. Cold, wet ingot dropped into a hot bath is a hydrogen and safety problem.
Melt control items that belong in the plan:
| Item | Typical window | Why it matters |
|---|---|---|
| Holding furnace temperature | 640-680 °C | Above roughly 720 °C, hydrogen solubility and iron pickup both climb |
| Dosing temperature at the shot sleeve | 660-710 °C | Sets viscosity, fill behaviour and die life |
| Degassing (rotary or lance, nitrogen or argon) | 10-20 min per treatment | Reduces hydrogen porosity, the dominant gas defect |
| Density index (reduced pressure test) | ≤ 3% general, ≤ 2% leak-critical | Quantitative proxy for dissolved gas |
| Slux / dross removal frequency | Every 2-4 h, and before every alloy change | Inclusions become leak paths and machining defects |
| Melt loss tracking | Typically 2-5% of charged weight | Sudden change indicates temperature or dross handling drift |
One practical point: the melt log is the first document to ask for when a defect appears. If it does not exist, or if the numbers are suspiciously identical shift after shift, the rest of the quality system is theatre.
First article layout and the capability baseline
The first piece layout is where you establish what the process can actually hold, before anyone commits to a production rate.
Procedure we recommend:
- Cast a minimum of 30 pieces per cavity at nominal process settings, from a stabilized die. Do not take the first five shots; the die is not at thermal steady state until somewhere between 20 and 60 cycles depending on part mass.
- Number every piece with cavity ID and shot sequence, so you can see thermal drift across the run.
- Perform a full dimensional layout on at least 5 pieces per cavity, and measure the key characteristics on all 30.
- Compute preliminary capability on the key characteristics. A casting process in the first hour that shows Cpk under 1.00 on a machined-later dimension is a warning: you will be buying capability from the CNC operation instead.
- Record the exact process settings that produced the acceptable parts: slow shot velocity, fast shot switchover position, fast shot velocity, intensification pressure and delay, die temperatures, cycle time, release agent dilution and spray duration. This becomes the baseline in the control plan.
- Sign limit samples for cosmetics, with the lighting and viewing distance recorded, and store one set at your plant and one at the supplier’s.
The output of this stage is not “PPAP passed.” It is a documented process window and a set of numbers you can regression back to when the process drifts in month nine.
In-process SPC: what to chart and how often
Not every dimension deserves a chart. Chart the characteristics that are critical to function, those that have historically moved, and those that are expensive to detect downstream.
Recommended practice:
- Subgroup size 5, sampling every 2 hours per cavity for a high-volume program, and every hour for a characteristic with a known drift rate. A 2-hour interval on a 40-second cycle means you learn about a shift after roughly 180 parts; if the consequence is a machined part, tighten it.
- Use X-bar and R charts on key dimensions, and p-charts or c-charts on defect counts such as leak rejects per hundred.
- Set alert and action limits. Common practice: alert at 2 sigma, action at 3 sigma, plus run rules for seven points on one side of the mean.
- Set the Cpk targets by criticality: Cpk ≥ 1.33 on machined and assembly-critical dimensions, Cpk ≥ 1.00 on as-cast dimensions where the drawing permits, and Cpk ≥ 1.67 on safety-related or sealing dimensions.
- Machine parameters are characteristics too. Trend the slow shot velocity and intensification pressure per shot, with automatic rejection of shots outside ±10%. This catches the drift that dimensional inspection finds an hour later.
A note on gauge R&R: before you trust a Cpk number, check the measurement system. On a die cast surface, gauge R&R above 10% of tolerance is common when the datum is a parting line flash witness or an as-cast face. Fix the datum scheme, usually by measuring from machined datums or by using a functional gauge, before arguing about capability.
Porosity: X-ray, sectioning and AQL levels
Porosity is the defect that separates a casting that passes layout from a casting that leaks or fails in service. There is no way to inspect it visually, so the plan needs a defined sampling and acceptance method.
- Method. Real-time X-ray for high volume, film or digital radiography for qualification, and periodic sectioning or microsection for root cause. Reference radiographs should be named in the drawing, commonly the ASTM E505 scale for aluminum die castings.
- Zone the part. Acceptance is not uniform. A gate area or a thick boss will contain some porosity by physics; a wall that separates pressure from atmosphere will not. Mark the zones on the drawing with different acceptance levels.
- Set AQL by consequence. For a structural or pressure boundary zone, AQL 0.65 to 1.0 on a defined sample size, with 100% screening when a lot fails. For non-critical zones, AQL 2.5 may be defensible.
- Quantify in the agreement. State the maximum acceptable pore diameter and the allowable clustered area per zone, for example single pore ≤ 0.5 mm and no cluster exceeding 1.5 mm across in the sealing zone.
- Track the count, not just the pass/fail. A rising trend in the reject count per hundred, even while every lot passes AQL, is the signal that a process parameter has moved.
Where porosity comes from is a separate subject with its own diagnostics, and the failure signatures are covered in our aluminum die casting porosity causes and solutions article.
Leak testing: method, limits and drift
Pressure decay is the standard method for die cast housings and valve bodies. The test is simple; specifying it so that it means something is not.
- Test pressure. Typically 1.5× working pressure, or a stated absolute value, for example 0.5-6 bar depending on the application. Hold time 5-30 seconds, plus a stabilization period.
- Reject limit. Expressed as a decay rate, in Pa/s or cm³/min at test pressure, not as “no bubbles.” A common practical limit for a small housing is a decay under 10-50 Pa/s after stabilization, but the number must come from a correlation test against actual field leakage, not from a round number.
- Correlation. Run a sample of parts to destruction, or submerge tested parts at the working pressure, to confirm the decay limit maps to a real leak. Do this once at qualification and again after any design change.
- Temperature. Aluminum and air both move with temperature. Test at a controlled part temperature, typically 20-25 °C, and let parts normalize after quenching or washing, or your reject rate will track the shift change rather than the process.
- Drift. Watch the mean decay value, not only the pass/fail result. A population mean creeping up over weeks with stable spread usually means microporosity increasing, and that points back at melt gas or at the intensification phase.
CMM versus functional gauges
Both have a place, and using the wrong one creates phantom problems.
- CMM for first article layout, for capability studies, for parts with complex GD&T, and for anything where you need a number rather than a decision. Cycle time on a CMM is minutes to tens of minutes, which limits it to sampling.
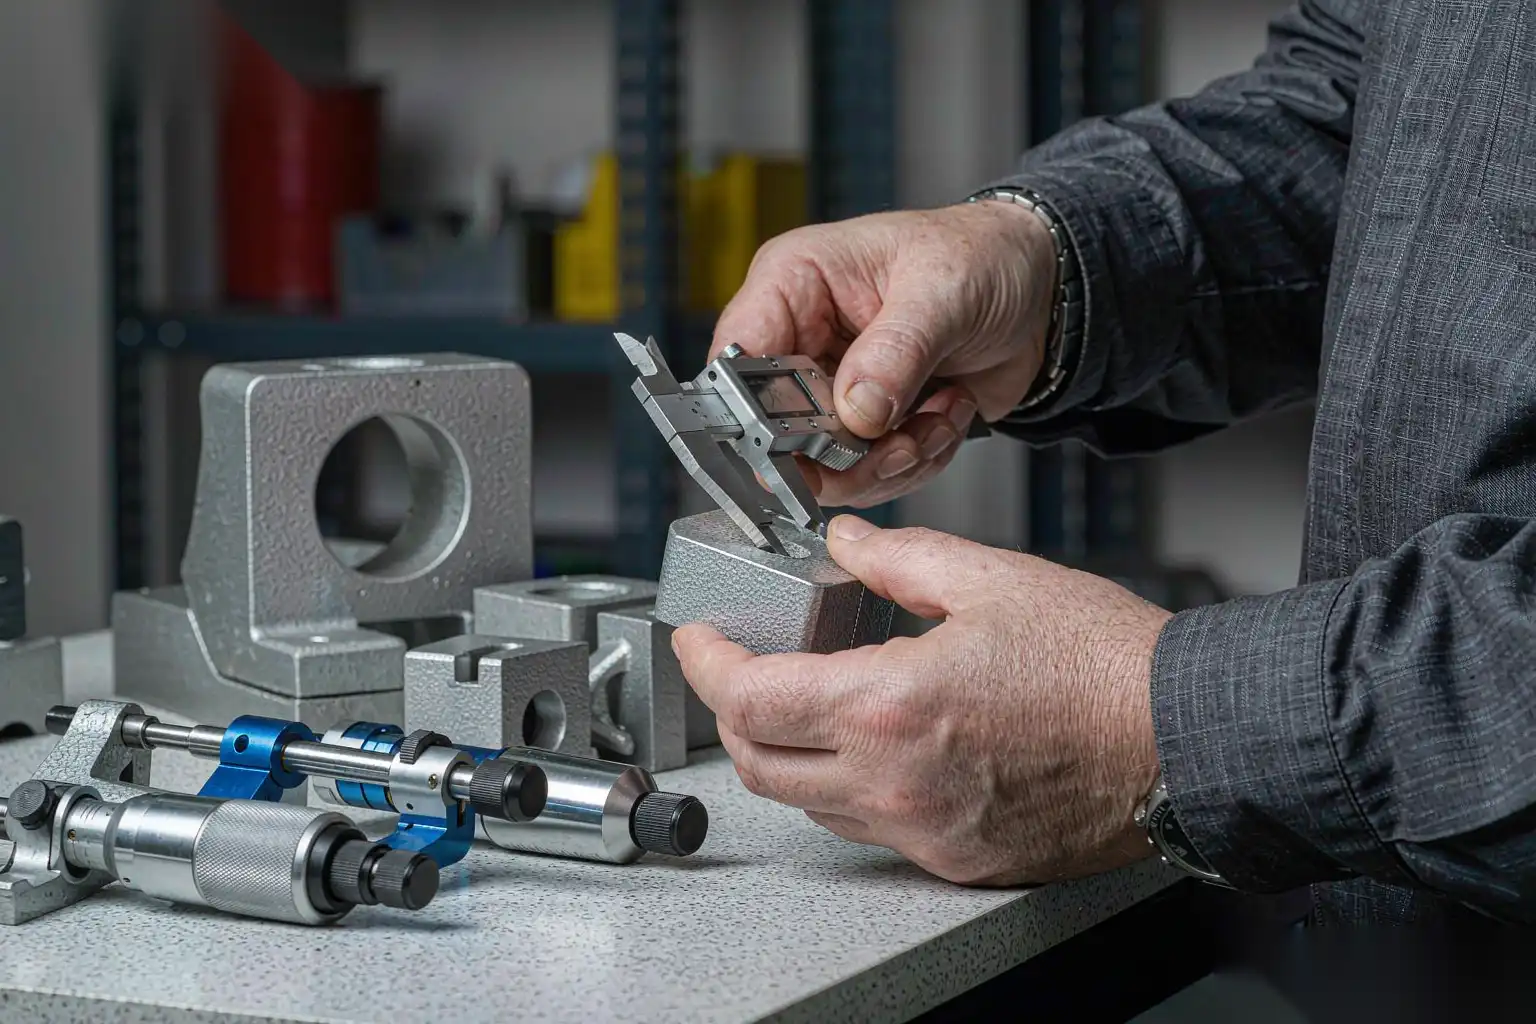
- Functional gauges and go/no-go fixtures for high-frequency in-process checks, for assembly interfaces, and for characteristics where the datum scheme is difficult on an as-cast surface. A well-built functional gauge with air jets or dial indicators gives a decision in seconds and is repeatable across operators, which matters more than precision when the question is “is this drifting.”
- Vision systems for burr presence, thread presence, flash height in a defined area, and surface blemish detection, especially where the cosmetic class is high.
- The reconciliation rule. When CMM and gauge disagree, the gauge wins for sorting and the CMM wins for root cause, but only if both are calibrated against the same datum scheme. Most disagreements trace to a datum difference, not to a measurement error.
Whatever the method, calibrate on a schedule and keep the record: annual for gauges, periodic verification of CMM against a certified artifact, and a recheck after any drop or crash.
Nonconformances and where dimensional drift actually comes from
When a key dimension moves, the cause is almost always one of six things. Working the list in this order saves time.
- Die temperature change. A 30 °C shift in the die surface changes solidification shrinkage measurably. Causes: a blocked cooling line, a change in spray duration, a change in cycle time, or an operator break that let the die soak.
- Die wear or damage. Ejector pin wear, core shift, slide wear, and solder buildup on a core all move dimensions. Solder is progressive, so the signature is a slow monotone drift over thousands of shots.
- Process parameter drift. Intensification pressure decay, accumulator nitrogen precharge loss, or a shot velocity change after a hydraulic service.
- Alloy or melt change. A new ingot lot with different silicon or iron shifts shrinkage behaviour. Check the heat log before touching the die.
- Quench and handling. Parts quenched hot and stacked can distort; parts allowed to age before machining move as precipitation continues. Natural ageing stabilizes most aluminum castings within roughly 7-30 days.
- Measurement itself. Gauge wear, a dirty datum surface, flash on the locating face, or a different operator technique.
Nonconformance handling should follow a fixed clock:
- Containment within 24 hours, including a sort of suspect material with a defined method and a marked boundary in the production sequence.
- Root cause within 5 working days, using the cause list above, with data rather than opinion.
- Permanent corrective action within 20 working days, with the control plan updated to detect the failure mode earlier.
- Verification over a defined production quantity, typically 3 consecutive lots or 5,000 pieces, before the corrective action is closed.
- A monthly review of reject Pareto, because the same three defects will account for 70-80% of the cost, and the plan should be re-weighted toward them.
Finally, keep the quality conversation connected to the drawing. Tolerance decisions made without reference to the process are the reason many control plans exist at all; our aluminum die casting tolerances guide sets out what the process holds as-cast versus what needs machining. And when the recurring defect is on the surface rather than in the dimension, the catalog in aluminum die casting defects and solutions is the faster reference.
DZ Machinery works on the downstream half of this picture. Where the reject Pareto is dominated by burr height variation, parting line remnants or edge inconsistency after trimming, manual deburring introduces exactly the operator-to-operator variation that a control plan cannot absorb. Our robotic deburring and grinding cells use force-controlled floating spindles with defined compliance and automatic tool change, so the removal amount becomes a machine parameter with a logged value rather than a human judgement. If you are writing a control plan and finding that your key characteristics are being created by a hand-held grinder, send us the part drawing and the burr specification and we will tell you what the station can hold.