

Robotic Cell OEE: Real Benchmarks, Hidden Losses and Where the Uptime Actually Goes
Most finishing cells we audit are running at an OEE between 42 and 58 percent, and most owners believe they are running at 75 to 85 percent. The gap is not dishonesty. It is that the cell looks busy all shift — the robot is moving, the spindles are turning, parts are coming off the conveyor — while the losses hide in places nobody logs: a 40-second abrasive change repeated 30 times per shift, a 9-second cycle that drifted to 11 seconds after a tool change, a fixture that needs two taps with a mallet to seat a warped casting.
This article is about measuring those losses properly and fixing them in the right order. It covers the three OEE factors with realistic benchmark numbers for deburring and polishing cells, the downtime causes that actually dominate, the performance losses that sit below the alarm threshold, a data capture plan you can run without buying a manufacturing execution system, targeted countermeasures with expected gains, and a worked improvement example with payback.
Our reference point is the robotic deburring, grinding and polishing cells we build at DZ Machinery for die castings and faucet hardware, but the method applies to any cell that consumes abrasives and holds parts in a fixture.
Defining OEE for a Finishing Cell
OEE is Availability times Performance times Quality, expressed as three percentages multiplied together. The definitions matter more than the formula, because this is where most internal OEE numbers get inflated.
Availability = Run time / Planned production time. Planned production time excludes breaks, shift changes and planned maintenance. Run time is everything else minus unplanned stops.
Performance = (Ideal cycle time x Total parts) / Run time. Ideal cycle time is the best demonstrated cycle, not the cycle from the machine quotation.
Quality = Good parts / Total parts started. Parts that need rework count as losses, whether or not they are eventually recovered.
Three decisions to make once and write down, because changing them later invalidates your trend:
- Does the cell stop when the upstream buffer is empty? If yes, starvation is an availability loss to this cell, even though the cause is upstream.
- Does a reworked part that goes back through the cell count once or twice in the denominator? Count it in the parts started and as a quality loss on the first pass. Otherwise rework becomes free.
- What is the ideal cycle time, and who has the authority to change it? It should be the fastest sustained cycle observed over at least 500 consecutive parts, re-baselined after any process change.
Realistic Benchmarks
| Metric | Typical first-year cell | Well-run cell | World class for this process |
|---|---|---|---|
| Availability | 72–82% | 88–92% | 94%+ |
| Performance | 68–80% | 88–93% | 96%+ |
| Quality (first pass) | 88–94% | 96–98% | 99%+ |
| OEE | 45–58% | 75–83% | 90%+ |
Context matters when reading these. A cell running five part numbers with manual load and a 30-minute changeover cannot hit the same availability as a dedicated single-part cell with an automatic load station. A polishing cell on a mirror-finish zinc handle has a lower achievable quality rate than a deburring cell removing a parting line burr, simply because the cosmetic acceptance band is narrower. Set the target from your own best demonstrated week, not from a textbook.
Note also that these numbers assume the cell is genuinely running. A cell that is idle two shifts out of three should be measured on the shifts it runs, and the idle shifts addressed as a capacity or scheduling question rather than buried in OEE.
The Downtime Causes That Actually Dominate
In our service data across deburring and polishing cells, five causes account for roughly 80 percent of unplanned downtime. In descending order of total minutes, not of event frequency.
Abrasive Change and Dressing
The single largest source, and the one most often excluded from the OEE calculation by accident. A belt wears out; the operator opens the guard, changes the belt, closes the guard, resets the spindle, and runs two verification parts. That is 4 to 9 minutes, and on a cell with three abrasive stations running a 60-second cycle it happens 15 to 30 times per shift. That is 60 to 180 minutes per shift, which is 12 to 38 percent of an eight-hour shift, and if the operator is shared across two cells the loss is worse because the second cell is starved while they are at the first.
What is happening physically: the abrasive cut rate decays as the grains dull. On aluminum, a fresh 120-grit zirconia belt removes roughly 2.5 times more material per pass than the same belt at 60 percent of its life. Operators compensate by increasing contact force, which changes the surface finish and accelerates the decay. The result is a cycle that is stable in time and drifting in quality.
Countermeasures, in order:
- Size the abrasive to the material removal requirement, not to the catalogue. If you are removing 0.15 mm from a 40 mm wide band, calculate the volume and select a belt life that gets you through a full shift. A belt that lasts 4 hours instead of 2 halves the change frequency.
- Use automatic abrasive indexing or a quick-change cartridge where the cycle time justifies it. Changing a 3-minute manual task into a 25-second automatic one is worth more than it sounds: 20 changes per shift at 3 minutes is 60 minutes; at 25 seconds it is 8 minutes.
- Batch the changeovers. Synchronise the stations so all belts are changed in one planned stop rather than three separate ones, and run it as a planned micro-stop with a defined procedure.
- Track cut rate, not just belt life. Log the material removed per belt and the surface result, and you will find the point where the belt stops cutting and starts burnishing.
Fixture and Part Location Issues
Second largest, and the most under-diagnosed. Symptoms: intermittent missed features, chatter, part movement during the cut, and an operator who taps the part with a mallet to seat it.
Root causes specific to castings:
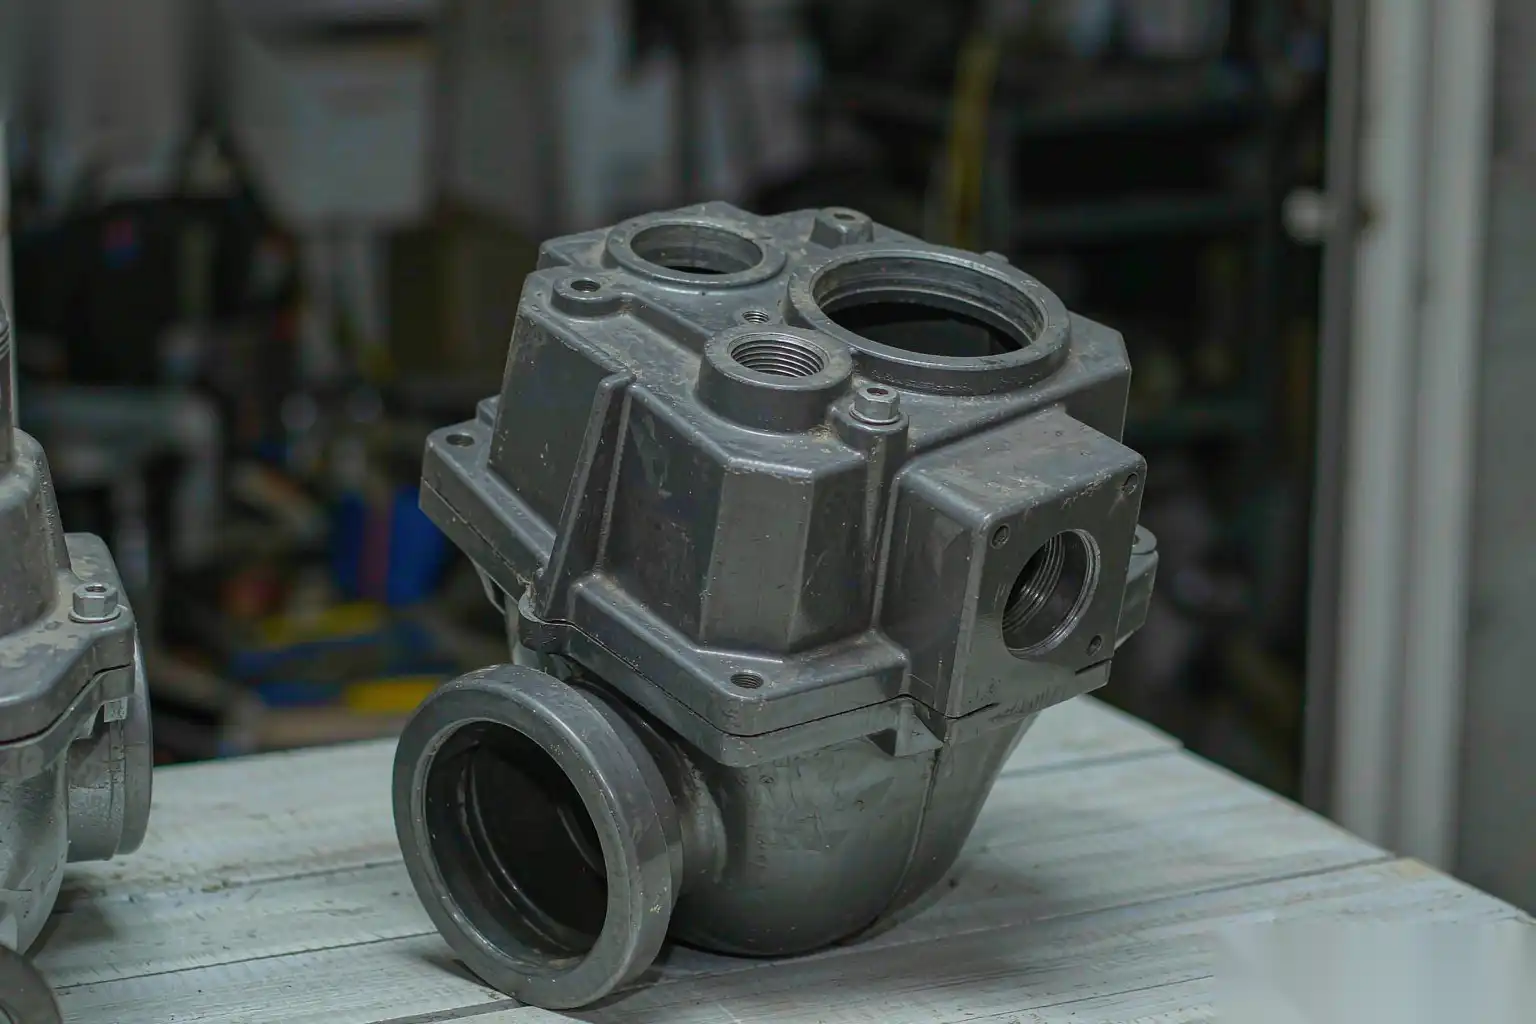
- Casting variation exceeding the fixture’s compensation range. A floating fixture with ±1.5 mm of compliance will locate a part with ±1.0 mm of casting variation and fail on the tail of the distribution.
- Locators on parting line flash or on gate vestige. If the datum pad on the casting has a 0.3 mm flash remnant, the part sits 0.3 mm high and every cut depth is wrong by 0.3 mm.
- Chip and swarf packing in the locator pockets. On aluminum this builds up within a shift; on a cell without a blow-off or a wash-down cycle, it is a two-hour failure.
- Clamp force too low for the cutting force. A 40 N contact force at 2,000 rpm generates a tangential force that will move a part held on friction alone.
Countermeasures: put the datum scheme in the casting drawing so the caster and the fixture builder agree; add a positive part-present and part-seated check with two proximity sensors rather than one; blow off the locators every cycle; and log the clamp pressure so a drop is an alarm rather than a slow drift.
Part Supply Starvation
Third, and the one that generates the most argument between departments. The cell is available, the robot is idle, and there are no parts. Causes: upstream machine down, forklift cycle, an operator on break, or a buffer sized for a different takt time.
The fix is rarely in the cell. It is a buffer sizing calculation: if the upstream process has an availability of 85 percent with a mean time to repair of 25 minutes, the buffer between it and the cell must hold at least 25 minutes of cell consumption, plus one container in transit. For a 55-second cycle that is roughly 30 parts plus a full container. Most cells we see have a buffer of 6 to 10 parts.
Also consider dual-station infeed so the operator or the conveyor can refill one station while the robot picks from the other. This converts a hard stop into a soft one and typically recovers 3 to 6 percent of availability on its own.
Collision Recovery
Fourth by minutes, first by pain. A collision stops the cell hard, and recovering takes 20 to 90 minutes on average: jog the robot out, check the spindle, check the fixture, check the tool, re-teach if the tool holder is bent, and then run verification parts. Worse, a collision that damages a spindle or a force sensor is a multi-day event with a parts lead time.
Root causes, in order of frequency: a part loaded out of position; a worn or broken tool holder; a program edited without dry-run verification; a fixture clamp that did not close; and a teach point drifted after maintenance.
Countermeasures that work:
- Force-limited spindles with a collision trip set just above the normal process force. On a floating spindle, a trip at 1.4 times nominal contact force catches almost every event before it bends anything.
- Torque monitoring on the spindle drive as a secondary trip.
- A mandatory dry-run in single-step mode after any program edit, with the interlock enforced in the controller, not in a work instruction.
- Tool length and tool presence check at each tool change.
Extraction and Dust Collection Faults
Fifth, and the most seasonal. Polishing generates fine dust; deburring aluminum generates chips and, in the wrong conditions, combustible dust. Extraction faults shut the cell down through interlocks, and they build slowly: filter loading raises the pressure drop, airflow falls, the cell trips on low flow, someone resets it, and it trips again 40 minutes later.
Track the differential pressure across the filter as a trend, not as a trip. Set a warning at 60 percent of the trip point and schedule the filter change. In humid climates, and in plants where polishing compound mist mixes with aluminum dust, filter loading roughly doubles; if you are running a cell in Southeast Asia or coastal Brazil, size the filter for that from the start.
Cycle Time Losses That Hide Below the Alarm Threshold
Performance losses are the hardest to see because nothing stops. The cell keeps producing, just slower than it should. Here is where the 10 to 15 percent typically goes.
- Acceleration and deceleration padding. Programmers add a safety margin to every move. Twenty moves at 0.3 seconds of unnecessary smoothing is 6 seconds per cycle; on a 55-second cycle that is 10 percent of performance, permanently.
- Robot-to-station handshakes. Every wait-for-signal has a latency. If the cell does eight handshakes per cycle at 150 ms of unoptimised logic each, that is 1.2 seconds.
- Conservative cutting parameters. If the belt surface speed or the feed rate was set during commissioning and never revisited, there is usually 8 to 15 percent available. On aluminum, surface speed in the 25 to 32 m/s range for coated abrasive is the normal working window; cells running at 18 m/s are leaving time on the table.
- Worn abrasive compensation. As the belt dulls, the cut per pass falls and the program makes the same number of passes for a worse result. The performance loss shows up as a quality loss later, which is why the two must be analysed together.
- Multi-pass drift. A program written for three passes becomes a four-pass program after someone adds a finishing pass to fix a cosmetic issue, and nobody updates the ideal cycle time.
- Operator paced load. If the load station is manual and the operator also runs another machine, the cell waits. Measure the actual load time against the designed load time; the difference is a performance loss, not an availability loss.
The way to find these is to time 30 consecutive cycles at the second-resolution level and look at the distribution, not the average. A unimodal distribution centered at 58 seconds with a 62-second ideal is a different problem from a bimodal distribution with peaks at 56 and 71 seconds. The second one has a discrete cause — a specific station, a specific part condition, or a specific program branch.
A Simple OEE Data Capture Plan
You do not need a manufacturing execution system to start. You need three data streams and a person who owns the numbers.
1. Automatic capture from the cell PLC (do this first). Log these tags at 1 Hz into a CSV on a local drive:
- Cell state (running, starved, blocked, faulted, manual, changeover) with a state reason code.
- Parts started counter and parts rejected counter, with reject reason if the operator can enter one.
- Cycle time per part, in milliseconds.
- Spindle load or contact force, per station.
- Abrasive change events, from the tool-change counter.
That is five tags. Most controllers can write them to a data log with no additional hardware, and a week of data at 1 Hz is a few hundred megabytes at most.
2. Manual reason entry for stops over 3 minutes. Keep the reason list short — under ten codes — or operators will pick the wrong one. Our default list: abrasive change, part supply, fixture, collision, extraction, quality check, program, other. Make the code entry mandatory to restart, or the data will be 60 percent “other.”
3. One shift-level summary, daily. Total parts, good parts, run minutes, planned minutes, and the top three stop reasons by minutes. Fifteen minutes per day, and it must be reviewed in a standing meeting or it will stop happening within three weeks.
Analysis cadence: weekly Pareto on downtime minutes by reason, and monthly re-baselining of ideal cycle time. Do not do daily OEE reporting to the shop floor as a performance metric; daily OEE is noisy and it drives gaming. Weekly trends, monthly decisions.
Countermeasures and Expected Gains
| Countermeasure | Addresses | Typical OEE gain | Implementation cost | Payback |
|---|---|---|---|---|
| Right-size abrasive, batch changes | Availability | +4 to +8% | Very low | Under 1 month |
| Automatic abrasive indexing or quick-change | Availability | +3 to +6% | Medium | 4–9 months |
| Buffer sizing to upstream MTTR | Availability | +3 to +6% | Low | 1–3 months |
| Dual-station infeed | Availability | +3 to +6% | Medium | 6–12 months |
| Part-seated verification with two sensors | Availability + Quality | +2 to +4% | Low | 1–2 months |
| Locator blow-off every cycle | Availability | +1 to +3% | Very low | Under 1 month |
| Force-limited collision trip + dry-run interlock | Availability | +2 to +5% | Low | 3–6 months |
| Tool presence and length check | Availability + Quality | +1 to +2% | Low | 2–4 months |
| Filter DP trending and planned change | Availability | +2 to +4% | Very low | Under 1 month |
| Optimise motion smoothing and handshake logic | Performance | +3 to +7% | Low (engineering time) | Under 2 months |
| Revisit cutting parameters, surface speed | Performance | +4 to +9% | Very low | Under 1 month |
| Re-baseline ideal cycle time | Measurement only | 0 | None | Immediate |
| Closed-loop force control on spindle | Quality | +2 to +5% | Medium | 6–12 months |
| In-cell gauging with automatic offset | Quality | +2 to +4% | Medium | 9–18 months |
Two points on using this table. First, the low-cost items at the top are worth more in total than the expensive items at the bottom, and they are usually available in the first month. Second, gains are not additive. Taking availability from 78 to 88 percent and performance from 74 to 88 percent multiplies, it does not add: 0.78 x 0.74 x 0.94 = 54 percent becomes 0.88 x 0.88 x 0.96 = 74 percent. That is a 20 point OEE gain, which represents roughly 37 percent more good parts from the same cell.
A Worked Example With Payback
A single-robot grinding and polishing cell for a faucet body, two shifts, 5 days per week.
Baseline (measured over four weeks):
- Planned production time: 80 hours per week (2 shifts x 8 hours x 5 days, minus breaks)
- Availability: 76 percent (18.9 hours per week of unplanned stop)
- Performance: 74 percent
- Quality: 91 percent
- OEE: 0.76 x 0.74 x 0.91 = 51.2 percent
- Ideal cycle time: 52 seconds
- Good output: 2,128 parts per week
Top three downtime causes by minutes per week:
- Abrasive change and dressing: 8.4 hours (69 events, average 7.3 minutes)
- Part supply starvation: 4.6 hours
- Fixture and seating faults: 3.1 hours
Actions taken, in order:
| Action | Cost (USD) | Availability effect | Performance effect | Quality effect |
|---|---|---|---|---|
| Longer-life belts, batch changeover procedure, pre-staged cartridges | 3,200 | +7.0% | +2.0% | +1.0% |
| Buffer increased from 8 to 34 parts with a gravity roller conveyor | 7,800 | +4.5% | 0 | 0 |
| Second proximity sensor for part-seated, locator blow-off added | 2,600 | +2.5% | 0 | +1.5% |
| Motion smoothing and handshake logic optimisation | 4,500 (engineering) | 0 | +6.0% | 0 |
| Abrasive surface speed raised from 19 to 28 m/s, feed re-tuned | 900 | 0 | +5.0% | +0.5% |
| Force-limited collision trip enabled and dry-run interlock added | 1,800 | +2.0% | 0 | +0.5% |
| Total | 20,800 | +16.0% | +13.0% | +3.0% |
Result after eight weeks:
- Availability: 78.5 percent measured, but with 4.5 points of the gain offset by the discovery of previously unlogged micro-stops that were reclassified once the PLC logging went in. Net 76 to 84 percent.
- Performance: 74 to 86 percent
- Quality: 91 to 95 percent
- OEE: 0.84 x 0.86 x 0.95 = 68.6 percent
- Good output: 2,853 parts per week, an increase of 725 parts per week
Payback:
- Additional contribution: 725 parts per week at 3.10 USD contribution margin = 2,248 USD per week
- Additional consumable cost from higher throughput: approximately 380 USD per week
- Net benefit: 1,868 USD per week, roughly 93,000 USD per year at 50 weeks
- Investment: 20,800 USD
- Simple payback: 11 weeks
Note what is not in that payback: the cell also absorbed a 12 percent volume increase without a third shift, and the cosmetic reject rate at plating fell because the abrasive change procedure stabilised the cut rate. Those are real but harder to attribute, and we leave them out of the calculation deliberately so the number is defensible.
Also note the honest part: the first two weeks after the PLC logging went in, reported OEE went down by about 6 points. That is normal and it is the most common reason OEE projects get cancelled. Nothing got worse; the measurement got better. Expect it and pre-announce it, or the project will be judged on week two.
Design Choices That Set the OEE Ceiling
Some of the OEE is determined before the cell is ever commissioned. If you are specifying a cell now, these are the decisions that matter:
- Abrasive capacity relative to removal volume. A cell that must change belts every 90 minutes cannot reach 90 percent availability. Ask for the belt life calculation in the proposal, not just the cycle time.
- Number of stations versus number of abrasive grades. Every grade change is a station, and every station is a potential stop. Sometimes two passes on one station with a different program beats three stations with a transfer between each.
- Automatic load versus manual load. Automatic load costs more and removes an entire class of starvation and pacing loss.
- Tool and abrasive management. Quick-change cartridges, tool presence checking and automatic dressing all convert a manual task into a machine cycle.
- Accessibility. If changing a belt requires removing a guard with six bolts, every belt change costs three extra minutes for the life of the cell.
- Fixture robustness. The fixture is the component most likely to determine your quality rate, and it is usually the last thing designed.
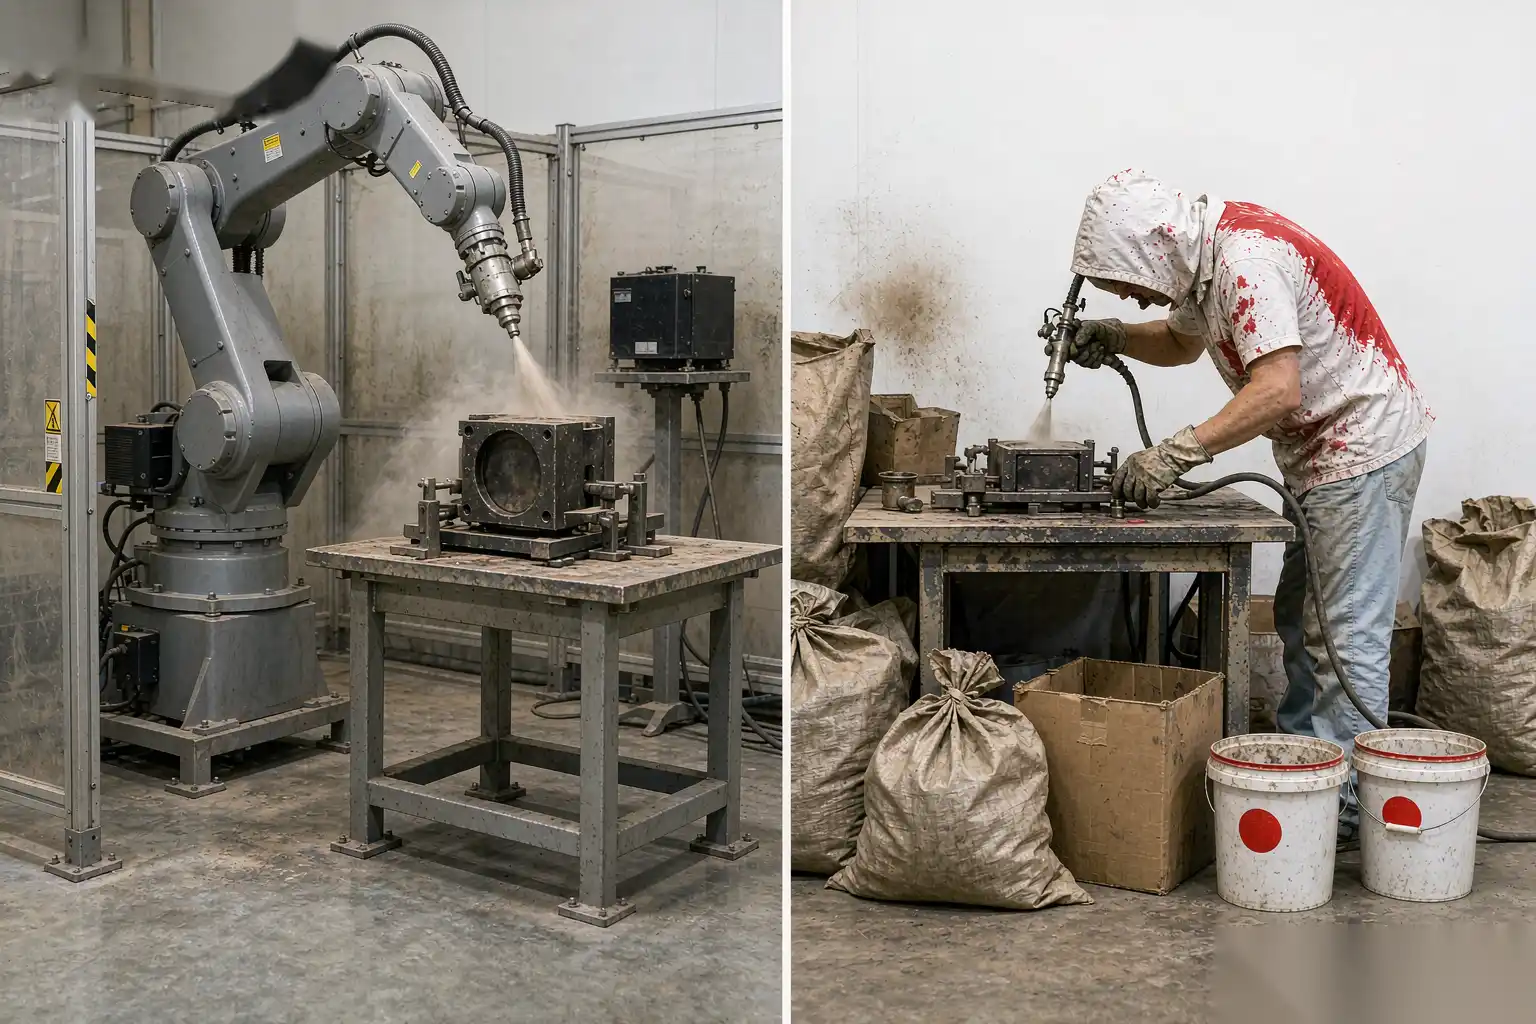
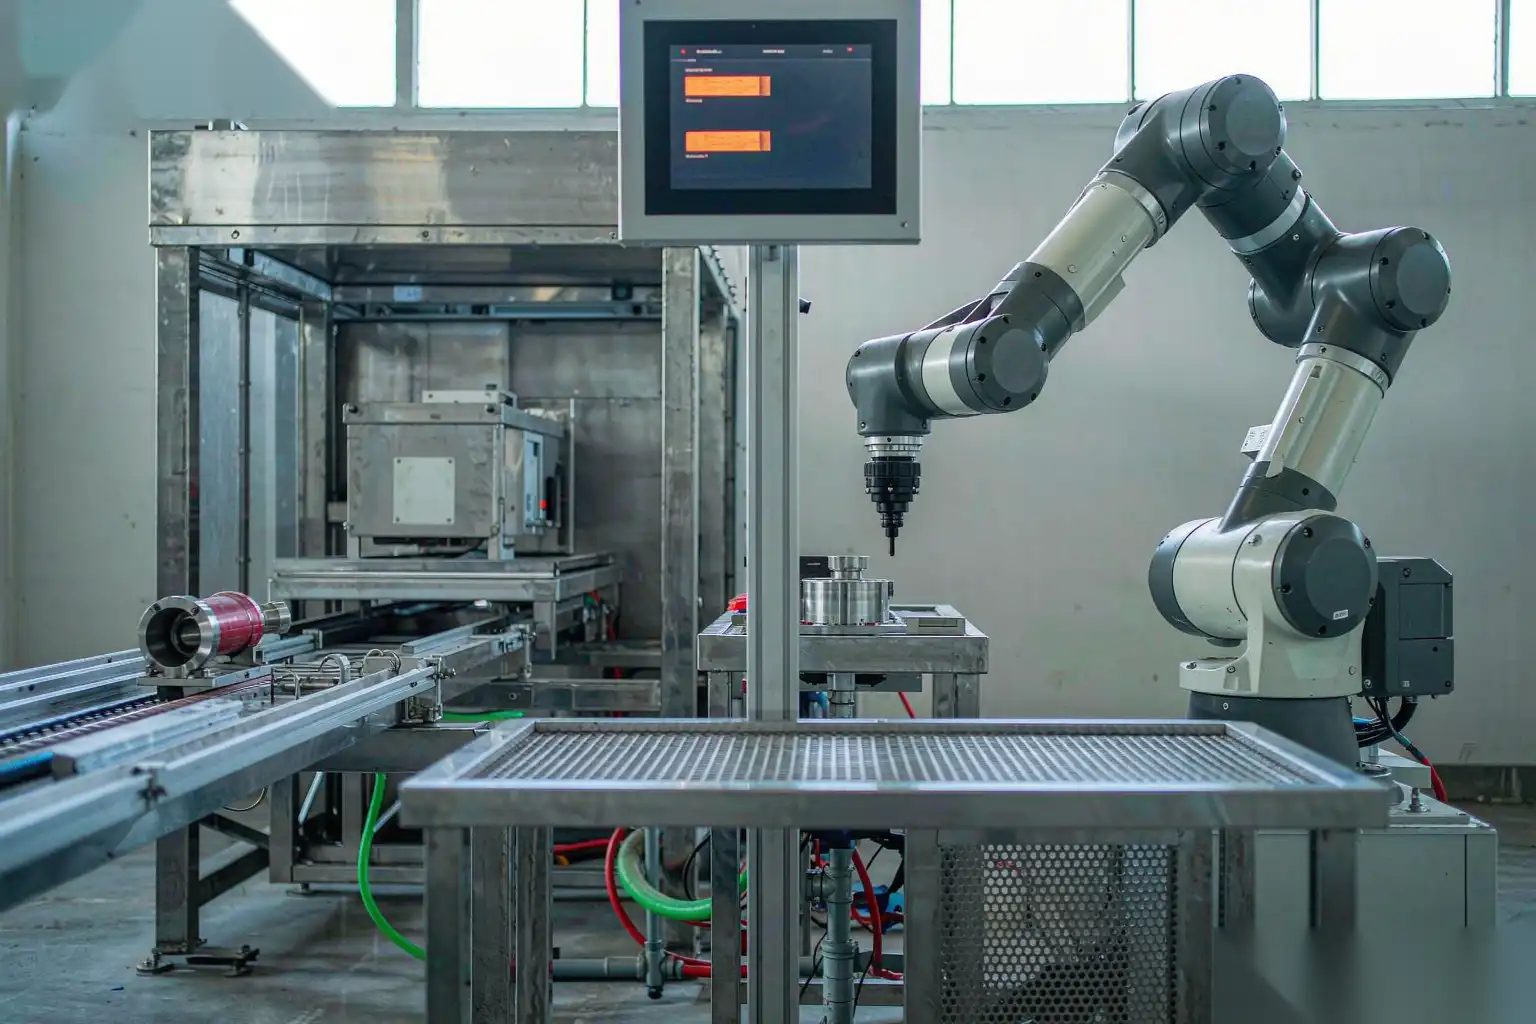
On the automatic deburring machine side of our site we go through the mechanics of how a cell is built up from spindle, media and fixture choices, and our automated surface finishing equipment range shows the cell configurations these numbers come from, and for a direct comparison of cell output against a manual bench, the robotic versus manual deburring analysis uses the same OEE framework applied to labor rather than to machines.
DZ Machinery builds robotic deburring, grinding and polishing cells for die castings and faucet hardware, and we design them around a measured OEE target rather than a quoted cycle time: abrasive life, buffer sizing, fixture compensation range and changeover procedure are all specified before the cell is built. If you have a finishing line and you suspect the real OEE is lower than the number on the report, send us the part drawings, your annual volume and your current shift pattern, and our engineering team will walk through the loss model with you and tell you where the first 10 points are.