

Die Casting Cycle Time Optimization: Reading the Time Budget and Finding the Real Seconds
Every die casting plant has a quoted cycle and an actual average cycle, and the gap between them is usually 8 to 15 percent. Nobody budgets that gap, nobody measures it separately, and it is where the cheapest capacity in the plant is hiding.
This article is a systematic method rather than a list of tricks. It starts with a phase-by-phase time budget, identifies which phases are safe to attack and which are not, covers the injection profile and intensification trade-offs, explains why thermal balance rather than machine speed sets the sustained limit, quantifies automation investments, and finishes with a worked before-and-after example with payback arithmetic you can take to finance.
Reading the Time Budget
Start by decomposing the quoted cycle into phases. Use the machine’s own cycle trace or a shot monitor rather than a stopwatch; modern machines will give you actual valve and plunger timings. Numbers below are representative for a mid-size part, roughly 1.8 kg shot weight in a two-cavity die, on a 350 to 500 tonne machine.
| Phase | Typical seconds | Time limited by | Safe to attack |
|---|---|---|---|
| Ladle or auto-pour | 1.2 to 2.5 | Ladle cycle and metal delivery | Yes, with automation |
| Die close and lock-up | 2.0 to 3.5 | Machine hydraulics and tonnage | Rarely; machine dependent |
| Slow shot stage (sleeve fill to gate) | 1.0 to 2.5 | Wave control to avoid air entrainment | Cautiously; see injection section |
| Fast fill (cavity fill) | 0.04 to 0.15 | Gate area, machine flow capability | Only with process qualification |
| Intensification build | 0.02 to 0.05 | Accumulator size and valve response | Tune, do not shorten below 20 ms |
| Holding / dwell until gate freeze | 2.0 to 6.0 | Gate thickness and local heat extraction | Yes, through cooling design |
| Solidification for safe ejection | 4.0 to 10.0 | Thermal balance, part geometry | The real limit; see thermal section |
| Die open and ejector cycle | 2.5 to 4.5 | Machine | Rarely |
| Part take-out | 4.0 (robot) to 15.0 (manual) | Handling method | Largest single controllable block |
| Die spray | 1.0 (micro) to 8.0 (flood) | Delivery technology | Largest avoidable cost |
| Blow-off and dry | 1.0 to 4.0 | Blow-off design | Yes |
| Interlocks, safety delays, miscellaneous | 3.0 to 8.0 | Usually legacy settings | Often yes |
That budget puts the controllable portions at roughly 15 to 30 seconds of the total, against 4 to 14 seconds of genuinely quality-critical time. The mistake plants make is attacking the quality-critical phases because they look like dead time on the screen. Removing a second of dwell before the gate freezes does not save a second; it buys you a rejection and a die cleanup.
A useful conversion for every discussion that follows: on a 40 second cycle, one second is 2.5 percent of throughput. Two shifts, 250 days, a fully burdened cell rate in the 80 to 110 USD per hour band, and one second is worth roughly 10,000 to 13,000 USD per year on a single machine. Quote seconds in money and improvements get prioritised very differently.
Where the Biggest Wins Usually Are
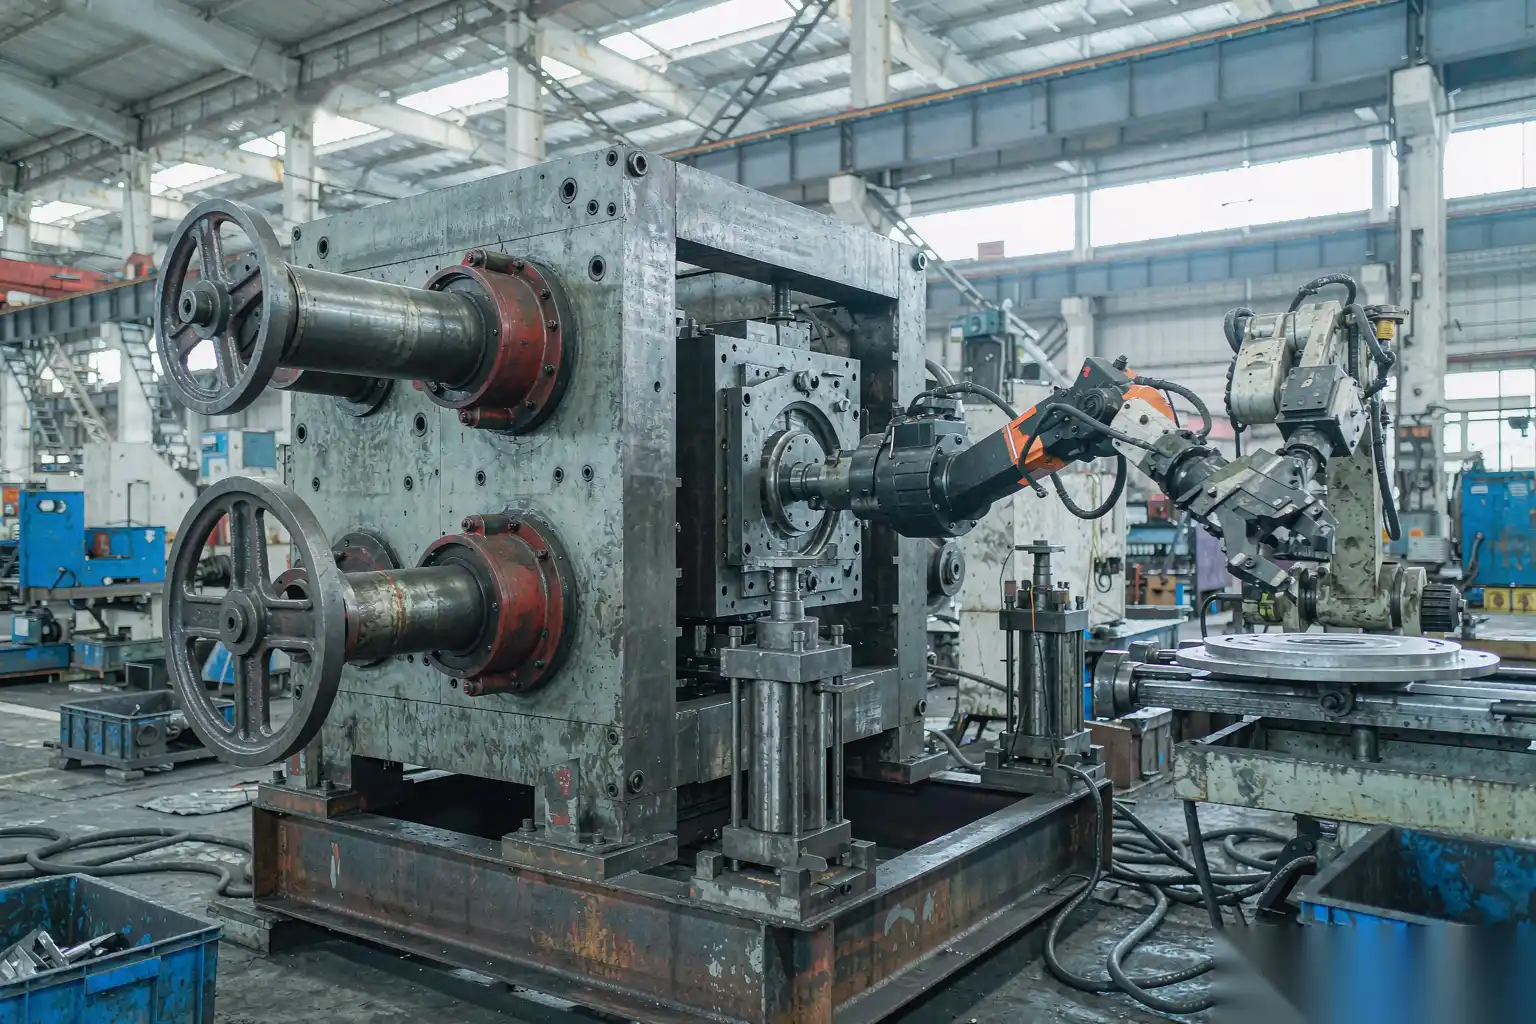
In our experience across die casting plants the ranking of opportunity is remarkably consistent.
- Take-out and extraction. Manual extraction is slow because it is human, variable because it is human, and it puts invaluable seconds between the die opening and the next shot. A robot takes the same path every cycle, can begin moving during die open, and can quench and orient the part consistently. Typical saving: 4 to 8 seconds, plus a queue of benefits downstream.
- Spray and drying. Often 20 percent of the quoted cycle. The single highest-yield project in casting cells, usually through metered micro-spray plus zone control plus directed blow-off. Typical saving: 2 to 5 seconds.
- Short stops and micro-stops. Twenty events of 30 seconds per shift is 10 minutes, which is more than 30 percent of a die change a week. Most plants never record anything under five minutes, so this money is invisible.
- Changeover time. Discussed separately below, and frequently larger in annual value than all cycle reduction combined.
- Start-up stabilisation time. The ten to thirty shots needed to bring a cold die to thermal equilibrium, plus the scrap they produce. This is not strictly cycle time, but it is available capacity and it responds well to engineering.
- Injection profile tuning. Usually 0.3 to 1.0 seconds, and it must be bought with process qualification rather than intuition.
What almost never yields a safe win is cutting dwell or accelerating the fast shot, because both trade directly against porosity and dimensional stability, and both push the cost into the operations we see downstream at the finishing cell.
Injection Profile and Intensification Timing
The plunger profile has two objectives that conflict: fill the cavity before the metal front freezes, while not entraining air on the way there.
Slow shot stage. The plunger travels through the shot sleeve at roughly 0.2 to 0.6 m/s, slow enough that a stable wave builds in front of it rather than a breaking one that rolls air into the metal. Go too fast and you generate air entrainment and oxide, which becomes porosity and bifilms; go too slow and you lose metal temperature in the sleeve and risk cold laps in thin sections. The critical velocity is set by sleeve fill level: if the sleeve is only partially filled, a fast plunger in a large-diameter sleeve produces a severe wave. Reducing sleeve diameter to increase fill percentage often allows a faster slow shot without quality loss, which is a legitimate source of cycle reduction.
Three practical notes. First, most plants run the slow stage longer than necessary because it was set during a qualification nobody revisited. Logging slow-stage distance against the point where metal actually reaches the gate often recovers 0.3 to 0.8 seconds. Second, optimising the first stage is much safer than touching anything downstream of it. Third, every change here must be qualified with X-ray or density measurement before it goes into production, because the failure mode is invisible until machining or polishing.
Fast fill. Cavity fill times are typically 0.03 to 0.12 seconds for normal wall thicknesses, with gate velocities in the 25 to 55 m/s range. Fill time is expensive to change because reducing it requires higher machine flow capability or larger gates, and larger gates lengthen the required dwell. This is a design-stage decision, not a shop floor lever.
Intensification. The intensification pressure must arrive while the gate is still open. Time to intensification after fill should be roughly 10 to 30 milliseconds, and pressure build should complete within about 20 to 40 ms. Two failure modes dominate, and neither shows up in the cycle-time data:
- Too early. The pressure spike hits while metal is still moving through the gate, producing flash that must be trimmed and costing die life. The part may look fine and carry internal stress.
- Too late. The gate has frozen, the pressure never reaches the casting, and internal shrinkage porosity results. This is one of the most common causes of porosity that gets misattributed to the melt.
Diagnosis is cheap: measure the actual pressure trace at the shot cylinder and the plunger position simultaneously, and compare it against the fill point. If chasing cycle time has shortened any part of this chain, the cost appears later as scrap and as additional work at the trimming and grinding stations. See aluminum die casting defects and solutions for how these defects present.
Thermal Balance: The True Limit on Sustained Cycle
Machine speed is almost never the limit. Thermal balance is.
Each shot deposits roughly 300 to 400 kJ into the die for every kilogram of metal poured. For a 1.8 kg shot that is roughly 540 to 720 kJ per cycle. At a 42 second cycle that is a continuous 13 to 17 kW that has to be removed through cooling lines, spray evaporation, conduction to the platens, and radiation to the plant. If you shorten the cycle without improving heat removal, the die temperature climbs until something gives: soldering, flash, dimensional drift, or thermal cracking.
The mechanism sets a hard floor on dwell:
- Gate freeze time. Empirically it scales approximately with the square of gate thickness. For ADC12-type alloys, a 2.0 mm gate freezes in roughly 0.8 to 1.2 seconds while a 3.0 mm gate freezes in roughly 1.8 to 2.6 seconds. Holding longer than the freeze time achieves nothing, and this is why gate thickness is a design variable with direct cycle-time consequences.
- Ejection temperature. Parts need to be below roughly 400 to 450 °C for ADC12 before ejection, otherwise they deform on the ejector pins or slump when handled. This is often the binding constraint on thick-section parts, and it is why thicker parts have inherently longer cycles.
- Steady state temperature spread. Aim for no more than about 50 °C variation across the die face once stable. Anything beyond that indicates a cooling circuit problem, which no cycle-time project will fix.
Where to intervene, in order of return:
- Conformal or intensified cooling on hot cores and the gate area. Removing 30 to 50 °C from a local hot spot typically buys 1 to 3 seconds. Cooling inserts and high-conductivity core materials (beryllium-copper or copper alloy pins) are the standard solutions for cores that cannot carry water.
- Water line maintenance. Scale and rust film in neglected circuits can reduce heat transfer substantially. Descaling on a schedule is a cheap, repeatable, and frequently overlooked few seconds.
- Correct flow, not more flow. Turbulent flow in cooling lines removes far more heat than laminar flow. Verify Reynolds number by checking flow per circuit with a flow meter; a die running 30 litres per minute where the design called for 60 will never reach the target cycle.
- Die preheat. Dies must reach equilibrium before producing good parts. Preheating to 150 to 250 °C before the first shot removes much of the stabilisation period and reduces thermal shock, which extends die life.
Note that start-up scrap is part of the same problem. Ten to thirty shots of scrap or rework per start, three or four starts per week, is several thousand parts per year. This is an availability and quality loss, and it responds to the same thermal controls.
Automating Ladle, Spray, and Take-Out
| Item | Indicative capital (USD) | Typical seconds saved | Secondary benefit |
|---|---|---|---|
| Automatic ladle, servo-driven | 15,000 to 30,000 | 1.0 to 2.5 | Shot weight repeatability to roughly ±1 percent; removes the operator from the pour station |
| Fixed manifold replace with metered micro-spray and zone valves | 8,000 to 18,000 | 2.0 to 4.0 | 60 to 90 percent less lubricant and water; far less wastewater; more uniform die temperature |
| Take-out robot with gripper and quench | 25,000 to 45,000 | 4.0 to 8.0 | Consistent part orientation reduces downstream handling and enables automated transfer to trim and finishing |
| Die-lock / interlock audit and interlock cleanup | 2,000 to 6,000 | 1.0 to 3.0 | Often pure waste from legacy settings nobody revisited |
| Shot monitor and parameter storage per die | 6,000 to 15,000 | 0.5 to 2.0 via stabilisation | Recipe recall cuts changeover setup; trend data shortens troubleshooting |
| Die preheat station | 4,000 to 9,000 | 8 to 15 min per start-up | Removes most start-up scrap; extends die life |
Two qualitative points matter more than the table. First, automation buys repeatability as much as it buys seconds, and repeatability is what raises OEE performance and quality rather than just peak rate. Second, the choice of take-out method determines how easily the part can be handed to downstream automation. A robot that places parts into a fixture or onto a conveyor in a known orientation is the enabler for automatic trimming and robotic deburring; manual extraction into a bin is where most of that value is lost. See automatic deburring machine how does it work for castings for how consistent part presentation changes what automated finishing can achieve.
Quick Die Change and OEE
Cycle time arguments often ignore that a machine cannot produce anything while it is being changed over, and many plants change dies two to four times per machine per week.
| Changeover element | Conventional | With quick-change hardware |
|---|---|---|
| Unclamping and die removal | 25 to 50 min with individual bolts | 5 to 10 min with hydraulic or mechanical quick clamps |
| Water and hydraulic connections | 15 to 30 min of hose work | 3 to 8 min with colour-coded multi-couplings |
| Centring and height adjustment | 10 to 25 min | Pre-set heights and stops remove most of it |
| First shots to good parts | 15 to 40 min including start-up scrap | 5 to 15 min with a preheated die and stored parameters |
| Total | 65 to 145 min | 18 to 40 min |
Saving roughly 75 minutes per changeover at three changeovers per week over 50 weeks is about 190 hours per machine-year. At a burdened cell rate of 90 USD per hour that is roughly 17,000 USD per machine per year, usually for capital of 10,000 to 25,000 USD. The less obvious benefit is commercial: shorter changeovers make small batches economic, which reduces finished goods inventory and improves responsiveness.
OEE makes this visible. A representative conventional cell might show availability 72 percent, performance 87 percent, quality 94 percent, which multiplies to about 59 percent. After cycle reduction plus quick change plus stabilised parameters the same cell typically reaches availability 80 percent, performance 92 percent, quality 97 percent, around 71 percent. That 12 point improvement is worth substantially more than any single cycle-time project, and the interesting part is that most of it comes from changeovers, micro-stops, and stabilisation rather than from moving the machine faster.
For plants quoting to customers, the same logic drives delivery promises as much as internal cost, and it is worth reviewing against aluminum die casting lead time guide.
Worked Example With Payback
Assume a two-cavity die on a 400 tonne machine, 5,000 scheduled hours per year at two shifts, fully burdened cell rate of 90 USD per hour including operator, energy, tooling amortisation and overhead. Conversion cost only, excluding metal.
Before
- Actual average cycle: 48.0 seconds, giving 75 shots and 150 parts per hour
- Availability 72 percent, performance 87 percent, quality 94 percent, OEE 58.9 percent
- Good output: 150 × 5,000 × 0.589 = 441,750 parts per year
- Cost base: 5,000 × 90 = 450,000 USD per year
- Unit conversion cost: 450,000 / 441,750 = 1.02 USD per part
Actions taken
| Measure | Capital (USD) | Effect |
|---|---|---|
| Take-out robot with quench and conveyor placement | 38,000 | −6 s cycle; consistent orientation |
| Metered micro-spray with zone valves | 14,000 | −3 s cycle; lower lube cost |
| Conformal cooling on hot core plus circuit descaling and flow verification | 9,000 | −1.5 s dwell |
| Difficult interlock audit | 3,000 | −1.5 s of legacy delay |
| Die preheat station | 7,000 | −12 min per start; most start-up scrap removed |
| Quick-change clamps and couplings | 18,000 | −75 min per changeover |
| Total | 89,000 |
After
- Cycle 36.0 seconds → 100 shots and 200 parts per hour
- Availability 80 percent, performance 92 percent, quality 97 percent, OEE 71.4 percent
- Holding output constant at 441,750 good parts now requires 441,750 / (200 × 0.714) = 3,094 hours instead of 5,000
- Avoided hours: 1,906 per year, worth 171,500 USD at the burdened rate
- Alternatively, running the full 5,000 hours produces 714,000 parts, a 62 percent increase in good output from the same asset
Payback on the released-capacity basis is about six months. Even on a conservative assumption that only half of the avoided hours can actually be redeployed, payback stays under a year. Add the working capital benefit of shorter changeovers making smaller batches viable, and the project is rarely marginal.
Measurement Discipline
Cycle time improvements are easy to claim and hard to prove, so instrument the process before changing anything.
- Use the machine counter, not the quoted cycle. Log per-shot cycle time with minimum, mean and standard deviation. A standard deviation above roughly 8 to 10 percent of the mean indicates instability worth fixing before chasing the mean.
- Separate the three OEE losses and record downtime reasons honestly, including anything over 30 seconds. If your data starts at five minutes, you are managing a fiction.
- Time-study a minimum of 30 consecutive cycles on video, then review frame by frame. Every plant we work with finds at least one phase that nobody knew existed.
- Change one variable at a time, allow 50 to 100 shots for stabilisation, and hold metal temperature, die temperature, lubricant concentration, and operator constant between the before and after readings.
- Re-qualify quality after any injection or dwell change: density index or X-ray, dimensional check, and a run of cosmetic parts through the finishing line. A cycle change that raises polish rejects has simply moved cost from one department to another.
DZ Machinery builds robotic deburring, grinding and polishing cells with force-controlled float spindles and automatic tool change, and we specify cycle times on real part trials rather than on drawings. If you are planning a cycle-time project and want the downstream finishing cell modelled as part of it rather than discovered afterwards, send us the part drawings and your current time budget.