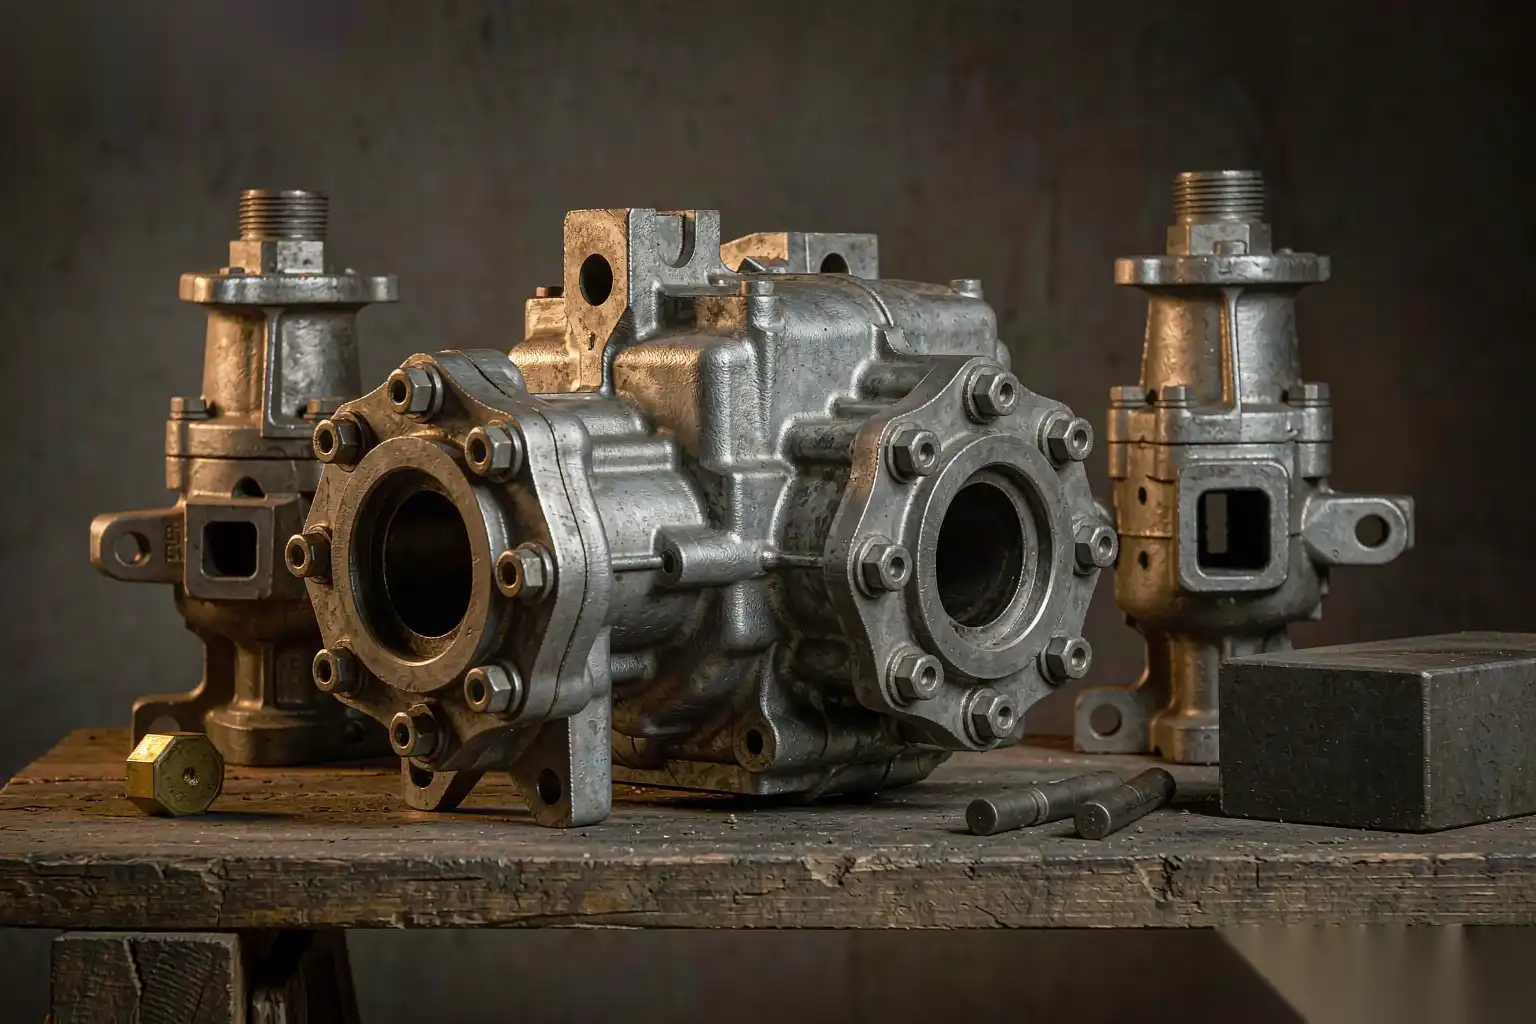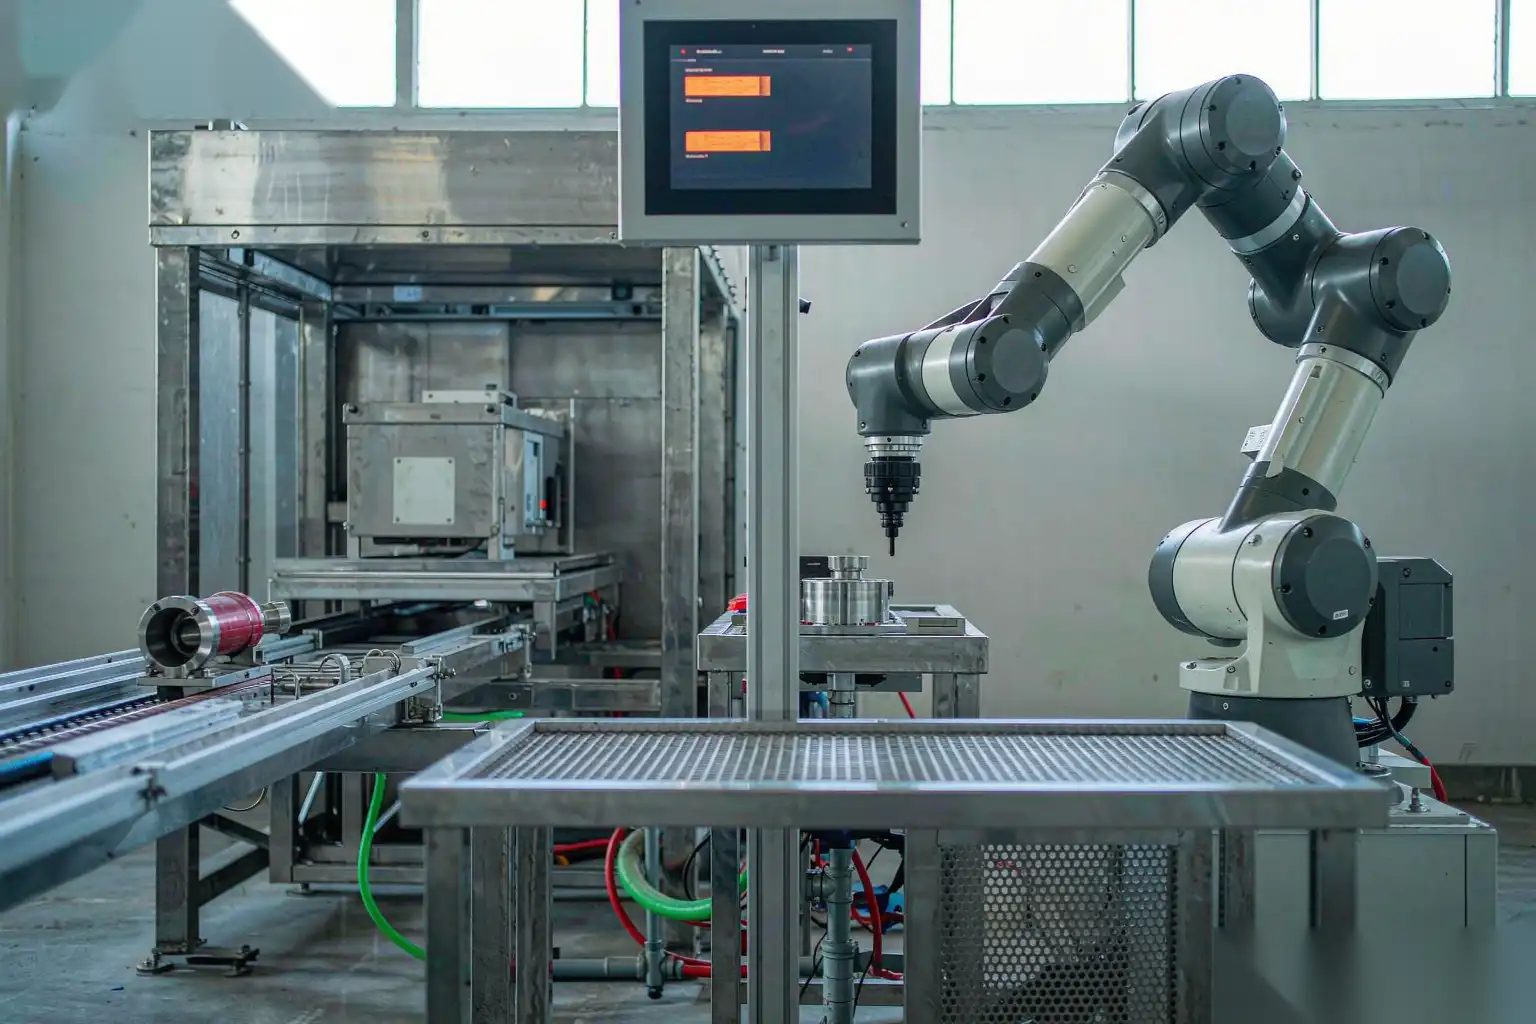


AT A GLANCE · Sanitary ware polishing forces a three-way decision: upgrade the manual line, add semi-automation, or commit to full robotic cells — and the wrong choice is expensive in both directions. A plant that over-invests strands capital on volumes it never reaches. A plant that under-invests keeps bleeding skilled labour it cannot replace. Comparing the three routes honestly, dimension by dimension, is the only way to choose well.
Route One: The Upgraded Manual Line
The manual route is not standing still. Modern benches bring better extraction, ergonomic positioning, and variable-speed spindles that reduce fatigue and compound waste.
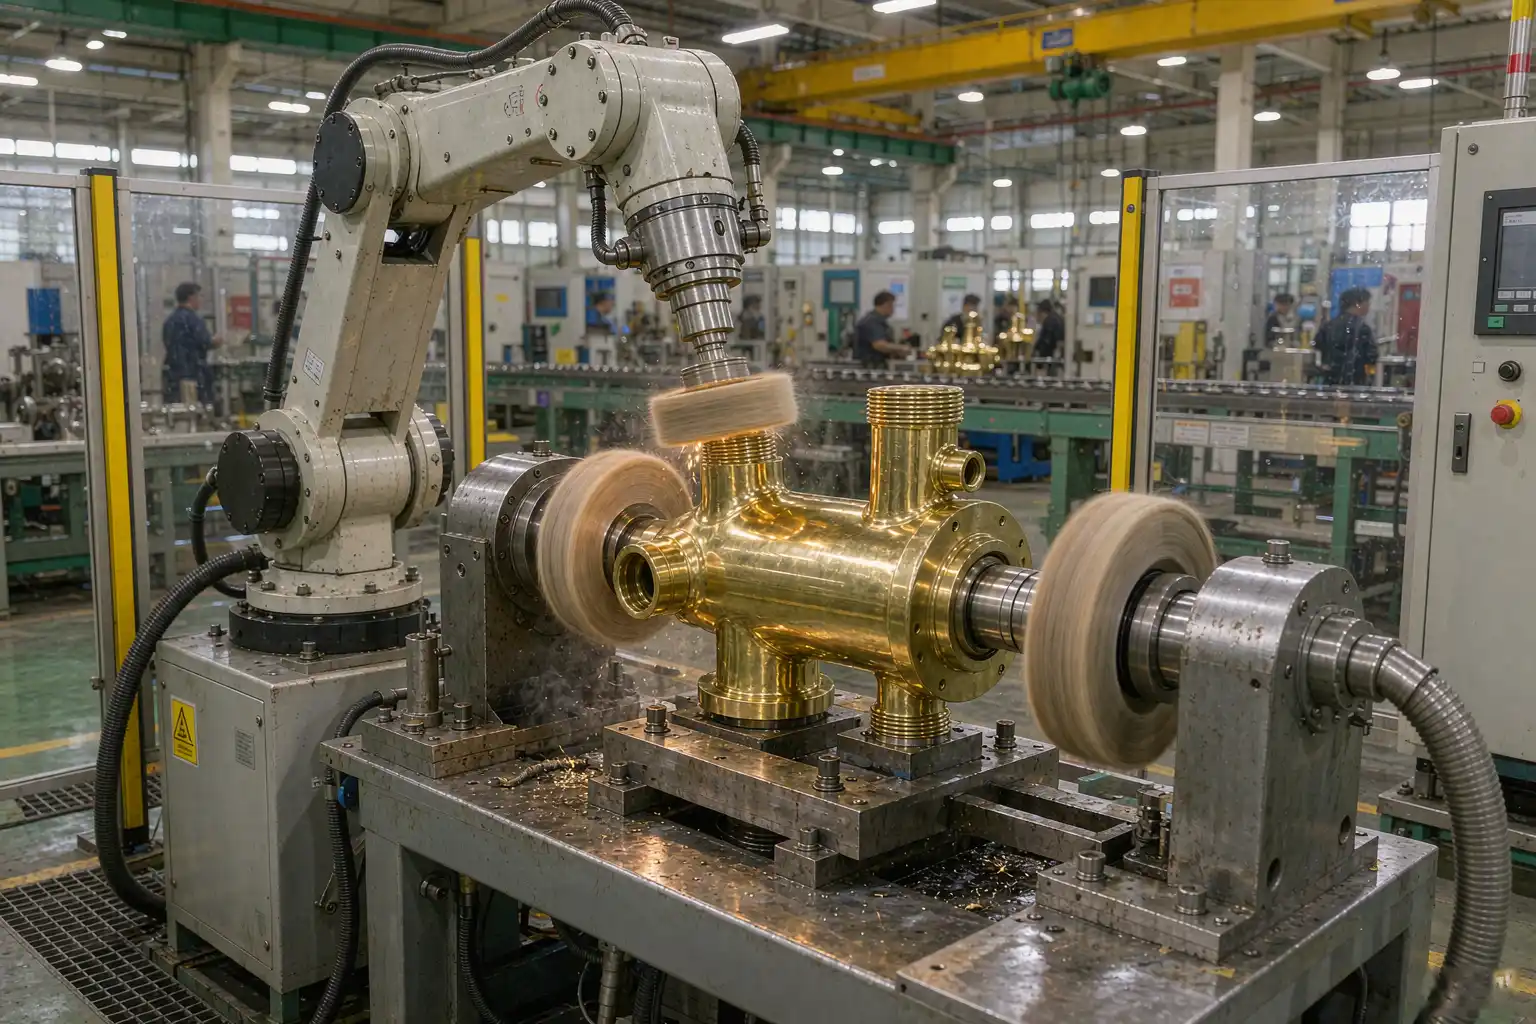
Strengths are real: maximum flexibility, minimal training for new SKUs, and low capital. A manual line absorbs a rush order of one hundred specialfinish faucets without a single program change.
Weaknesses are equally real. Output scales only with headcount, consistency drifts within every shift, and the labour pool shrinks yearly. Every sanitary-ware labour survey tells the same story: experienced buffers retire faster than recruits arrive.
Therefore the manual route suits plants with low volumes, high SKU variety, and available labour. Those conditions describe fewer factories every year.
Route Two: Semi-Automation
Semi-automation keeps people at the quality-critical steps and mechanises the repetitive ones. Typical layouts pair a carousel of buffing stations with manual load, or a robot performing only the rough cut while polishers finish.
This route cuts the hardest labour first. The robot handles the heavy cut pass that burns out workers’ shoulders, and humans keep the colour pass where judgement matters.
However, semi-automation inherits manual’s ceiling on consistency. As long as human hands perform the final pass, the final surface varies by individual and by hour.
Semi-automation suits plants migrating gradually, or those with geometrically wild parts that resist fixturing today but may not next year.
Route Three: Full Robotic Cells
Full automation hands the entire sequence — cut, colour, residue clear, and often inspection — to programmed cells. Operators load, monitor, and audit rather than buff.
The strength is uniformity at volume. A cell produces the same mirror on faucet number one and number one thousand, at a cycle time no arm can sustain for eight hours.
The cost is commitment: fixtures per SKU, programs per geometry, and capital up front. For example, a plant running sixty stable SKUs and two-shift production fits the profile perfectly. A plant running three hundred volatile SKUs needs careful fixture strategy before committing.
Robotic faucet buffing has become a proven package, which reduces the perceived risk considerably compared with five years ago.
The Head-to-Head Comparison
The table below compares the routes on the dimensions that decide real projects. Numbers are typical mid-size sanitary-ware plant figures, not laboratory ideals.
| Dimension | Manual Line | Semi-Automated | Robotic Cells |
|---|---|---|---|
| Daily output (per lane) | 600–900 parts | 1,000–1,400 parts | 1,500–2,200 parts |
| Surface consistency (Ra spread) | 0.12–0.15 µm band | 0.08–0.10 µm band | 0.03–0.05 µm band |
| Direct labour per shift | 8–12 skilled | 4–6 skilled | 1–2 operators |
| New SKU introduction | Hours | Days | Days to weeks |
| Rework rate (typical) | 3–6 % | 2–4 % | Under 1 % |
| Capex per lane | Low | Medium | High |
| Scalability | Headcount only | Limited | Add cells |
Decision Rules by Plant Profile
Volumes decide first. Below roughly one thousand parts per day per lane, manual and semi-automated routes stay defensible. Above that, robotic cells pull away on every economic curve.
SKU stability decides second. Stable families with long production runs amortise fixtures and programs quickly. Volatile catalogues need either standardised part platforms or a shared flexible cell.
Labour reality decides third. Where skilled buffers simply cannot be hired, the manual route is not an option regardless of the spreadsheets.
| Plant Profile | Recommended Route |
|---|---|
| Under 800 parts/day, 300+ SKUs | Upgraded manual with ergonomic benches |
| 800–1,500 parts/day, mixed SKUs | Semi-automation on cut pass, manual colour |
| Over 1,500 parts/day, stable families | Full robotic cells |
| High volume but volatile catalogue | Robotic cell with zero-point fixture strategy |
| Labour unavailable at any wage | Robotic cells, phased by family |
The Chrome-Mirror Quality Gate
Whichever route runs, the customer applies one gate: the chrome mirror. Plating amplifies every substrate defect, so polishing must reach plating-ready uniformity before chromium reveals all sins.
Manual lines fight this gate with skill and inspection labour. Semi-automated lines fight it with a mixed record, since the human final pass reintroduces variation.
Robotic cells pass the gate by physics. Programmed force windows and wheel geometry repeat identically, so the Ra band tightens to the range platers prefer.
This is why the comparison above measures Ra spread rather than average roughness. Plating quality tracks the spread, and the spread is exactly where automation dominates.
What a Real Migration Delivers
One mid-size manufacturer of mid-range sanitary fittings moved from twelve manual stations to two robotic cells plus one shared flexible cell. The numbers after six months of stable production tell the story.
| Metric | Before (Manual) | After (Cells) |
|---|---|---|
| Daily polished output | ~850 assemblies | ~1,300 assemblies |
| Buffing headcount | 12 across two shifts | 3 across two shifts |
| Plating reject rate | 4.2 % | 0.8 % |
| Compound spend per 1,000 parts | 100 % baseline | 74 % |
| Rework loop time | 2–3 days | Same-day |
The plating reject reduction carried hidden value: the plating house raised its throughput priority for the plant because batches arrived cleaner and more uniform.
The Staged Migration Path
Most plants should not leap from manual to full automation in one jump. The staged path below captures most of the benefit at each step while limiting exposure.
- Stage 1: robotic cut pass alongside manual colour — proves programs and fixtures on live production
- Stage 2: add robotic colour cells for the top three SKU families — captures volume consistency
- Stage 3: flexible shared cell for the long tail of SKUs — ends the manual dependency
- Stage 4: inline inspection with vision feedback — closes the quality loop
Each stage pays for itself before the next begins, and the plant retains a manual fallback bench throughout the transition.
Equipment Selection Within the Route
Choosing the route is strategic; choosing the machines is tactical but equally consequential. Sanitary-ware geometry rewards machines designed around curved bright work.
Choosing a sanitary-ware polishing machine deserves its own study, because spindle power, wheel access, and force control differ meaningfully between suppliers.
Grinding capacity matters for the upstream step. Sanitary fittings grinding removes gate stubs and blends machining marks before buffing begins, and underpowered grinding bottlenecks the whole lane.
Mistakes That Kill the Business Case
Three mistakes repeatedly damage these projects. First, comparing routes on capex alone while ignoring labour trajectory — the cheapest line today is rarely cheapest across five years.
Second, automating an unstable product. If castings arrive with wandering gate stubs, the cell inherits chaos. Fix upstream quality first.
Third, skipping operator training. Cells without trained tenders run at sixty percent of their rated output, quietly destroying the projected payback.
Running the Numbers for Your Plant
Model the decision over five years. Include labour cost growth, recruitment difficulty as a risk premium, rework cost, and plating rejects — not just direct wages.
Most models show the crossover where robotic cells win happening between eighteen and thirty months for plants above the volume threshold. Below it, semi-automation often holds the best risk-adjusted position.
Sensitivity-test the model on SKU count. If fixture costs balloon past fifteen percent of project capex, revisit part family standardisation before signing anything.
Maintenance and Consumables Across Routes
Running cost differences hide in maintenance schedules and consumable burn rates. Manual lines consume wheels and compound at skill-dependent rates; cells consume them at program-dependent rates.
Manual benches average eight to twelve grammes of compound per hundred parts, with wide variance between operators. Robotic cells hold six to eight grammes because application pressure stays constant and excess gets wiped instead of thrown.
Wheel life follows the same pattern. A cotton mop in a manual station needs dressing every few hours by feel; the cell logs spindle hours and schedules dressing before finish drifts, not after.
Maintenance labour differs in kind. Manual lines need mechanical attention on spindles and extraction; cells add program backups, fixture checks, and calibration of the force sensors. Both cost money, but cell maintenance is schedulable while manual-line repair is reactive.
Budget therefore compares total consumable spend plus downtime, never line items alone. On that combined basis, the automated routes widen their advantage every year as labour rates rise.
Making the Call
Sanitary ware polishing rewards plants that match the route to their real profile, not to their ambition. Volume, SKU stability, and labour availability — in that order — pick the winner.
Involve the plating house early in the decision. Platers see the downstream consequences of each route every day, and their reject statistics carry more truth than any supplier brochure.
Visit reference plants running your candidate route with similar catalogue breadth. Ask about the second year, not the commissioning week, because long-run uptime and consumable drift tell the real story.
Run the honest comparison, walk the staged path if volume justifies it, and measure Ra spread as the referee. The plants that choose this way stop guessing and start compounding quality year over year.
A practical first move costs nothing: pick one fast-moving model family, pull twelve months of defect and rework records for it, and ask your plating house to rank the reject causes. That single spreadsheet usually shows whether polishing inconsistency or true casting defects drive your scrap. If finish variance leads, the robotic route has a business case before you ever sign a quote. If casting quality leads, fix the upstream process first and let the polishing cell wait its turn.
This is educational content, not a specification or a quote.