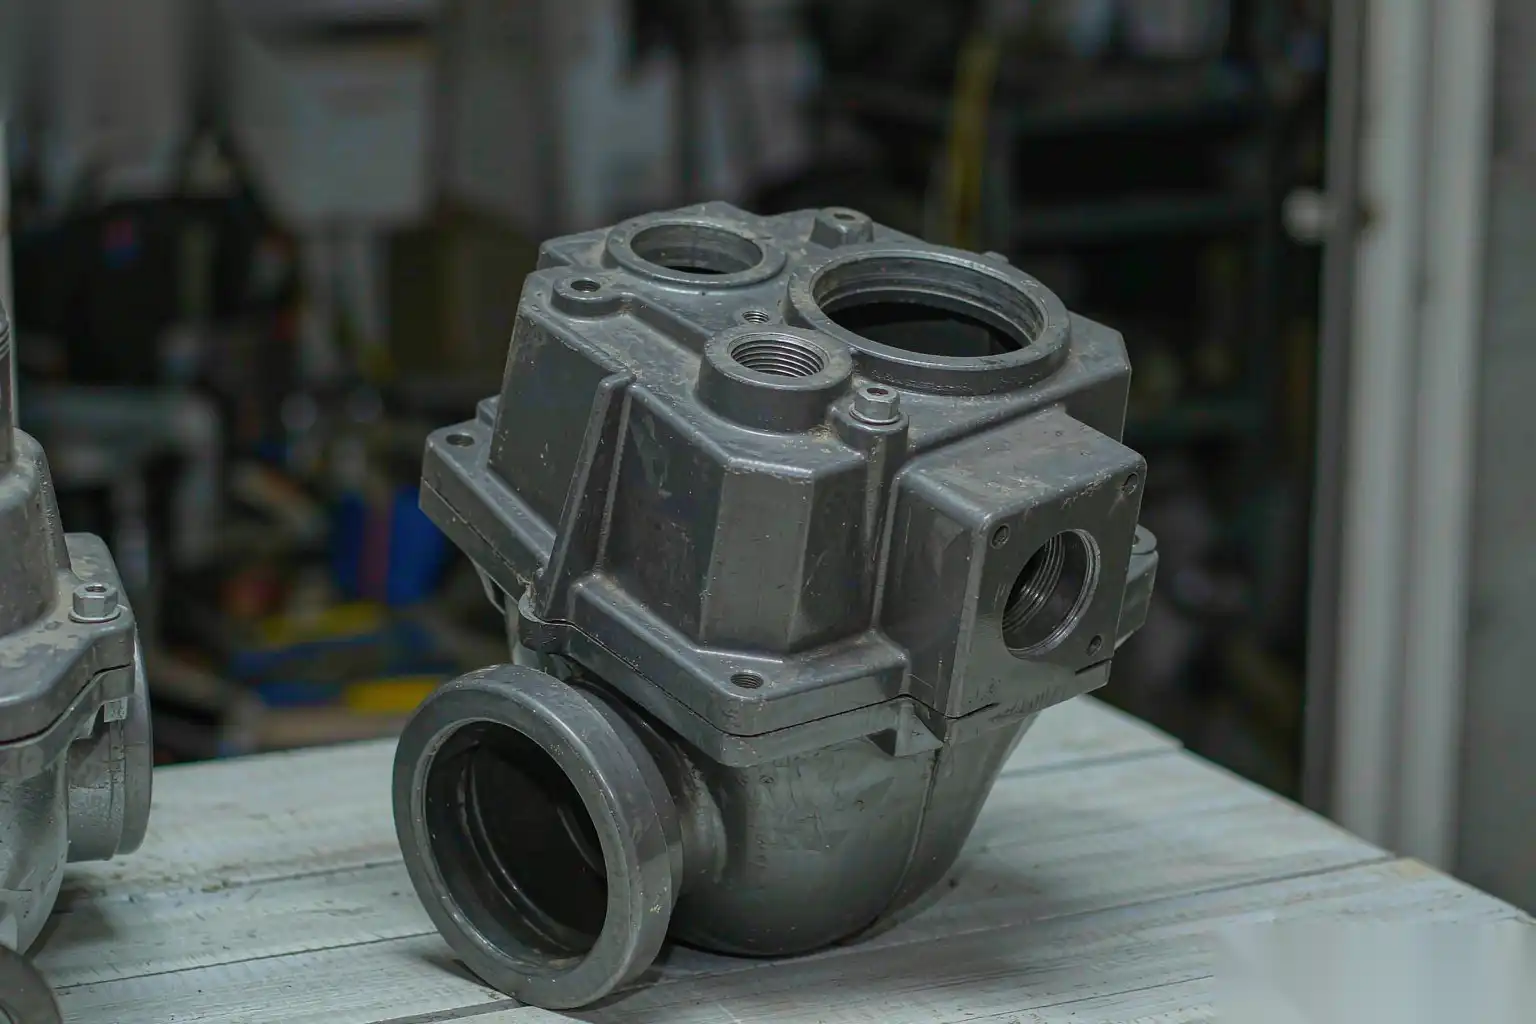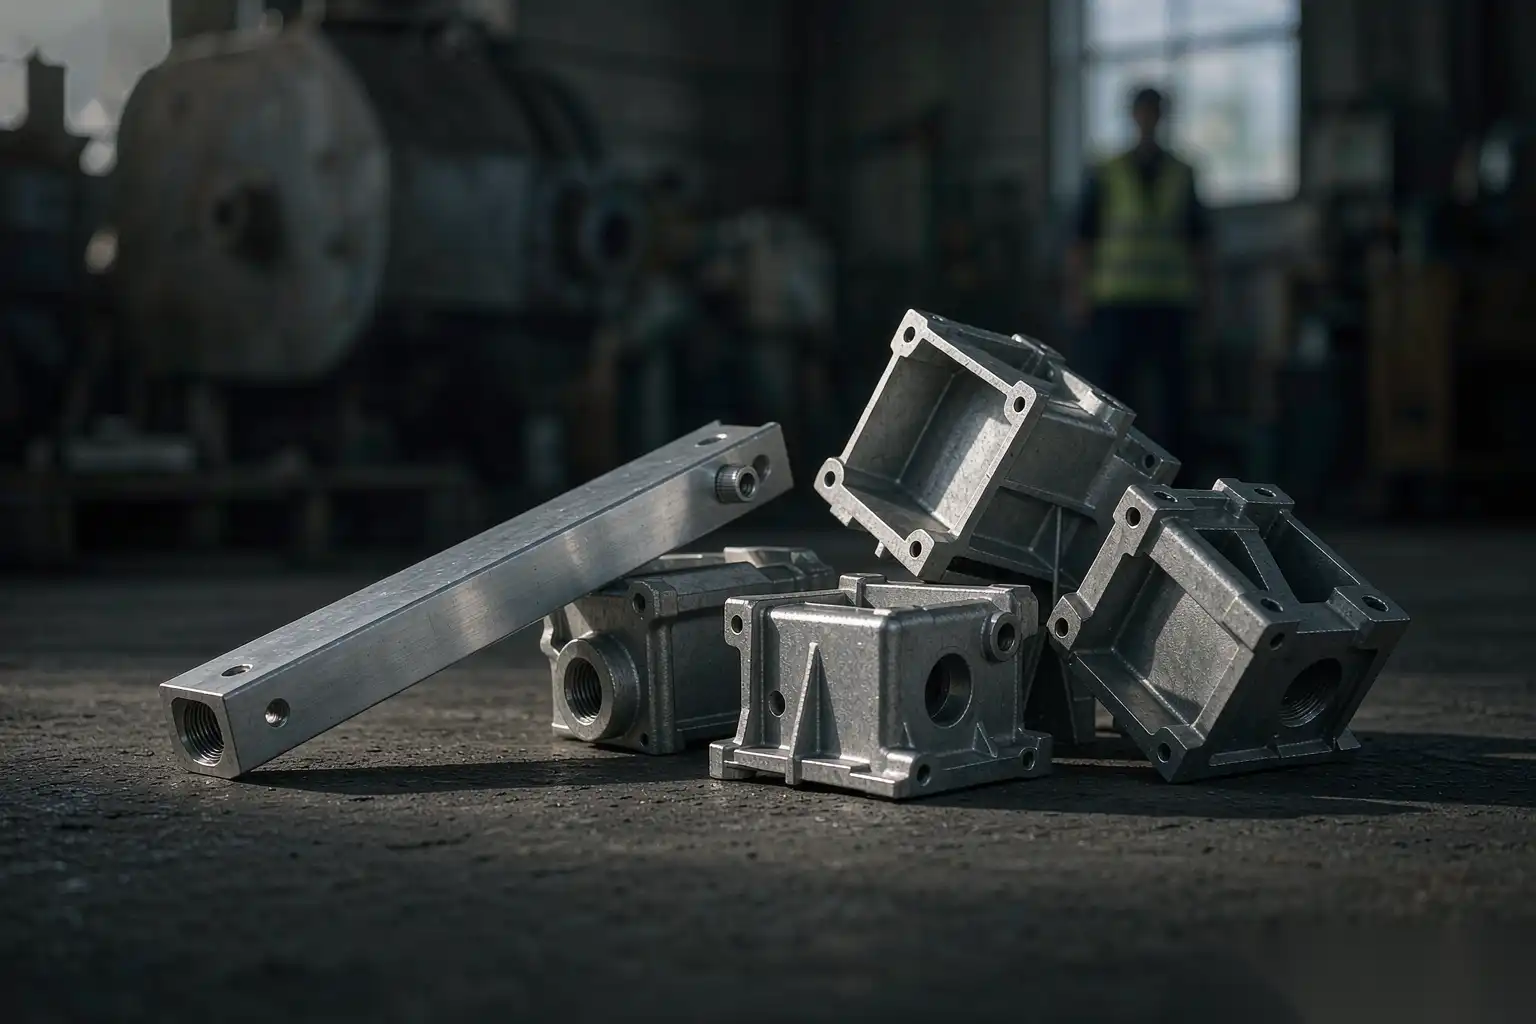


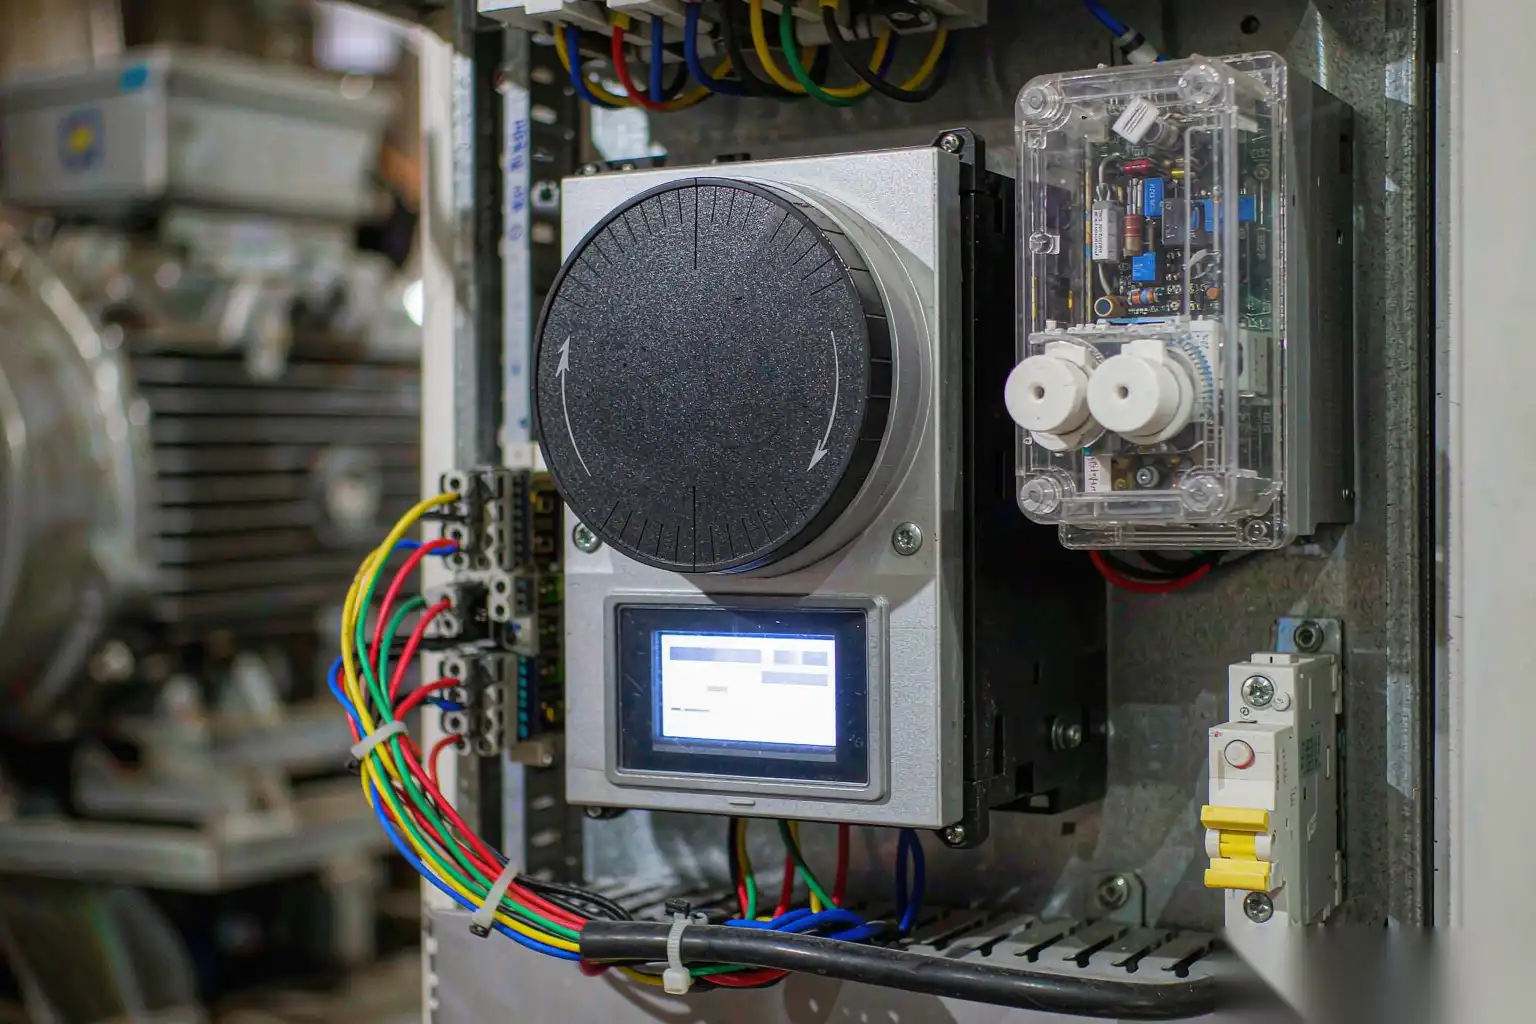
Die Casting Energy Cost per Part: How to Build a Model Finance Will Accept
Energy is usually quoted as a plant-wide utility line and then allocated to products by headcount or floor area, which is why cost saving projects get approved or rejected on arguments rather than on numbers. The alternative is not complicated. It takes metered data, three allocation rules that anyone can follow, and an honest separation between energy that varies with output and energy that does not.
This article gives the practical figures we use when reviewing a die casting plant’s cost structure: melting energy per kilogram with realistic furnace efficiencies, holding losses, machine and auxiliaries per cycle, compressed air, cooling water and extraction, a full worked calculation for a mid-size part, the honest comparison against material and labour, and reduction measures with expected ranges. It closes with how to structure the cost model so that a finance department will use it.
Why Energy Belongs in the Part Cost Model
Energy deserves a line in the part cost for three reasons that have nothing to do with sustainability reporting.
- It is usually 8 to 15 percent of conversion cost, which places it above labour on many automated cells. Material dominates everything else, but material price is set by the market while energy is set by your plant.
- It is controllable. Unlike alloy price and unlike the machine you already bought, energy responds to capital and discipline with predictable returns. Most of those returns sit in the 10 to 30 percent range with paybacks measured in months.
- It correlates with process health. Abnormal compressed air consumption means leaks or worn nozzles. Rising melting energy per tonne means oxidation losses and poor charging practice. Holding losses climbing means insulation and lid discipline have slipped. Energy data is process diagnostics that finance happens to pay for.
There is also a commercial reason. When a customer asks why a part price moved, an answer built on kilowatt-hours per good part with a metered baseline is much harder to argue with than one built on “our costs went up”.
Melting Energy per Kilogram
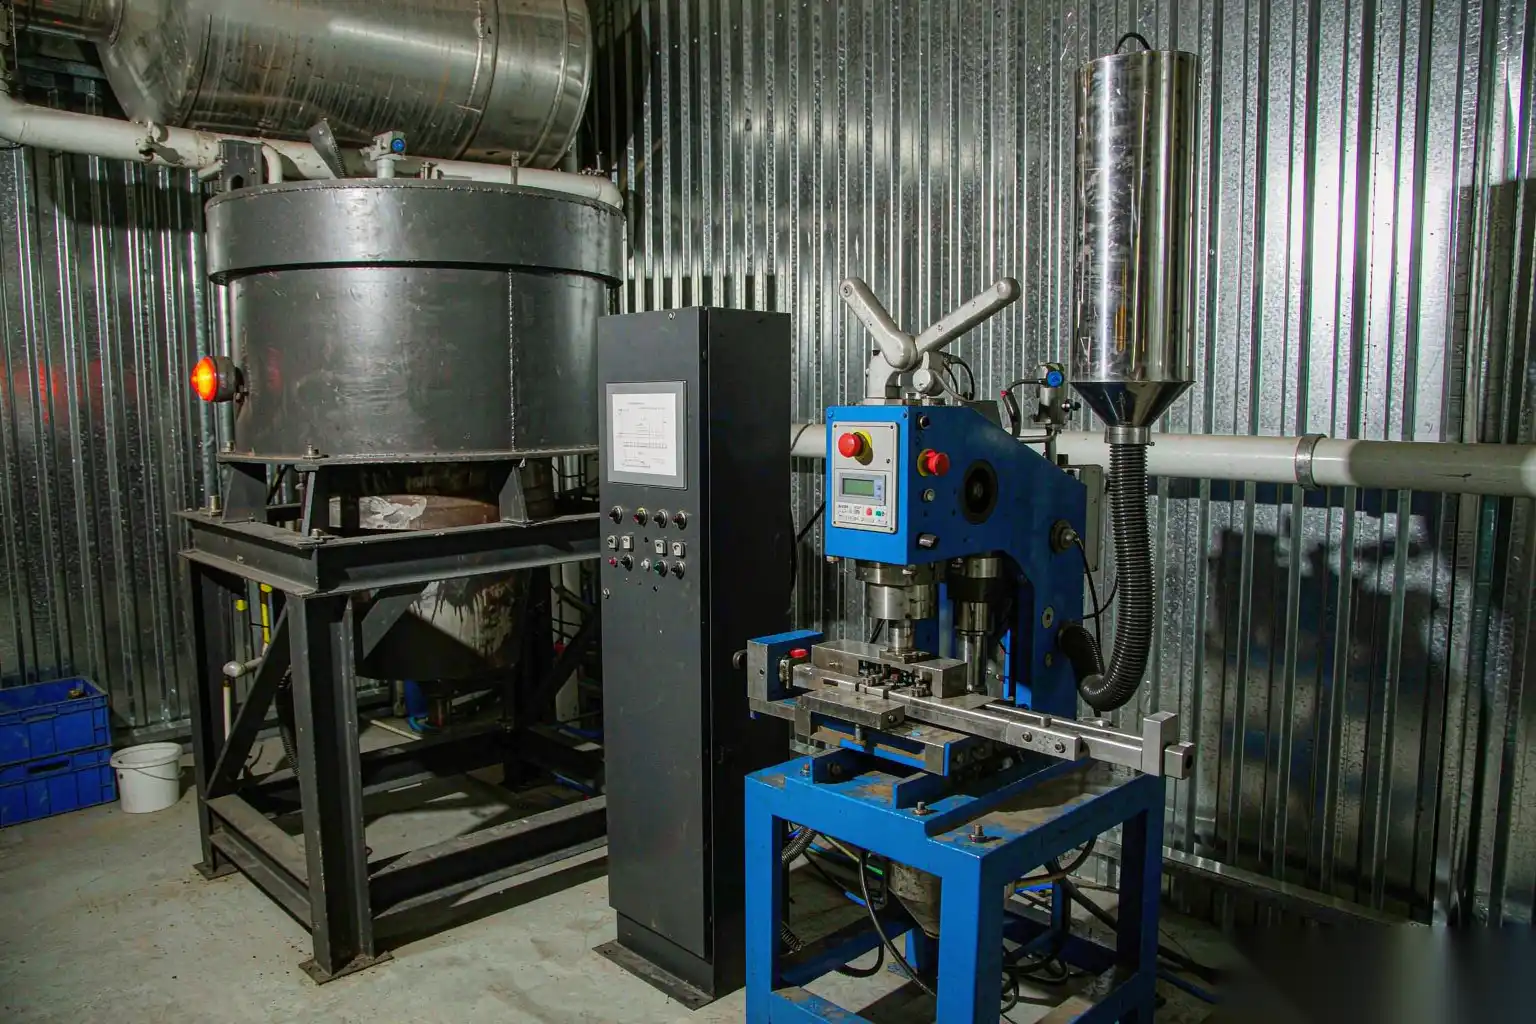
Start from theory so that you can judge any real number you are given. Heating aluminium from 25 °C to 720 °C takes roughly 0.52 MJ/kg as solid, about 0.39 MJ/kg of latent heat, and roughly 0.16 MJ/kg heating the liquid, giving a theoretical minimum close to 1.07 MJ/kg, which is 0.30 kWh/kg.
Everything above that minimum is furnace inefficiency, and the spread between technologies is large.
| Furnace type | Typical energy per kg cold charge | Equivalent kWh/kg | Notes |
|---|---|---|---|
| Theoretical minimum | 1.07 MJ | 0.30 | Physical floor; nobody reaches it |
| Modern stacked or shaft melter with recuperator and charge preheat | 1.2 to 2.0 MJ | 0.33 to 0.56 | Best available; high capital, needs continuous operation |
| Electric induction furnace, well run | 2.0 to 2.7 MJ | 0.55 to 0.75 | Clean, fast, good metal quality control |
| Electric resistance crucible furnace | 2.2 to 3.6 MJ | 0.60 to 1.00 | Common in smaller plants; simple but slow |
| Gas fired crucible furnace | 2.5 to 4.0 MJ | 0.70 to 1.10 | Cheap to buy, expensive to run |
| Gas reverberatory furnace, no recuperation | 3.5 to 6.0 MJ | 0.97 to 1.67 | Only justifiable at scale with recovered waste heat |
| Tempering or superheating liquid metal only | 0.4 to 0.8 MJ | 0.11 to 0.22 | Cheapest stage; the reason hot metal transfer pays |
Two accounting points that change the answer materially.
First, decide what you allocate. Metal that circulates inside the plant as runner, biscuit and rejects is melted again and again, and charging it all to one part is wrong. The clean approach is to charge each part with the metal that leaves the plant in it, plus process loss. In practice: multiply net casting weight by roughly 1.05 to cover oxidation and handling loss, and apply your melting specific energy to that. If you instead re-melt cold Returns because your layout does not allow hot returns to go back to the holding furnace, that decision costs you real money and should show up in the number.
Second, watch metal loss itself. Oxidation loss running at 4 percent instead of 2 percent on a 2.30 USD per kg alloy costs 0.046 USD per kilogram of shipment, compared with melting energy of around 0.045 USD per kilogram at the middle efficiency figure above. Metal loss and melting energy are roughly the same order of magnitude, and the loss is usually the easier of the two to reduce.
Holding Furnace Standby and Idle Losses
Holding losses are simple, continuous, and almost entirely unmanaged. Typical figures for aluminium holding furnaces at 650 to 720 °C:
| Furnace capacity | Well-insulated, lids closed | Typical industrial condition |
|---|---|---|
| 300 kg electric | 3 to 5 kW | 5 to 8 kW |
| 500 to 800 kg electric | 5 to 9 kW | 8 to 15 kW |
| 800 to 1500 kg electric | 8 to 14 kW | 12 to 24 kW |
| Equivalent gas fired units | 8 to 18 kW | 14 to 30 kW |
Expressed per unit of capacity, expect roughly 0.015 to 0.03 kW per kilogram of furnace capacity at temperature. Losses rise markedly with setpoint: holding 50 °C hotter than necessary typically adds 15 to 25 percent to standby consumption, and it costs you simultaneously in hydrogen pickup and die life.
Where the money actually goes:
- Weekends and shutdowns. An 800 kg holding furnace at 15 kW idling for 48 hours consumes 720 kWh, around 72 USD at 0.10 USD per kWh. Fifty weekends is roughly 3,600 USD per furnace per year for making nothing.
- Idle during die change and breakdown. If your availability is 72 percent, then 28 percent of furnace hours produce no parts. Depending on your setback policy, that is 20 to 30 percent of furnace energy being charged to nothing.
- Oversizing and parallel operation. Running two furnaces at 30 percent load each instead of one at 60 percent can be 30 to 50 percent worse in total standby loss. Consolidate where the metal logistics allow.
- Lid discipline. An open lid radiates and pulls cold air across the melt. Every minute the lid stays open is measurable; the fix is a procedural rule, not equipment.
A practical policy: maintain at setpoint during production, drop to a reduced setpoint for stoppages longer than about two hours, and fully shut down for planned stoppages beyond eight hours, with a defined restart and metal quality verification procedure written alongside it. The restart cost is mostly verification labour, and it is small compared with the weekend electricity.
Machine Hydraulic and Drive Energy per Cycle
Die casting machines consume energy in three ways: the hydraulic power needed for injection and clamping, pump losses during idle phases, and auxiliary loads such as machine-side hydraulics, extraction of the injection accumulator, and controls.
| Machine drive technology | Installed power, 400 tonne class | Average draw during production | kWh per cycle at 42 s | kWh per kg of shot (2.4 kg) |
|---|---|---|---|---|
| Older fixed-displacement pump, no unloading | 55 to 75 kW | 30 to 45 kW | 0.35 to 0.53 | 0.15 to 0.22 |
| Variable-displacement pump with unloading | 45 to 65 kW | 18 to 26 kW | 0.21 to 0.30 | 0.09 to 0.13 |
| Servo-driven or hybrid machine | 35 to 55 kW | 10 to 18 kW | 0.12 to 0.21 | 0.05 to 0.09 |
Two things matter here. The first is the ratio between peak and average. A fixed pump machine draws close to full motor load whether it is injecting or sitting in dwell; during the dwell phase most of that energy is going across a relief valve as heat, which then has to be removed by the cooling system, so you pay for it twice. The second is that every cycle has a fixed component, meaning that energy per part improves sharply when cycle time improves and when you use both cavities productively rather than blocking one off.
Also note that clamp stroke and die open time consume energy without producing anything, so anything that shortens non-productive phases shows up on this line immediately. That argument is developed further in the cycle-time budget discussion in aluminum die casting cost factors.
Compressed Air: The Largest Line Item Nobody Owns
In plant after plant, compressed air is the biggest non-melting energy consumer, and the one with the least ownership. Nobody’s budget line includes it, nobody is measured on it, and it is treated as free.
The conversion factor to keep in your head: a well-run screw compressor delivers roughly 1 m³/min of air at 7 bar for every 6 to 7 kW of input power. Poorly maintained, undersized or badly sequenced systems run at 9 to 12 kW per m³/min. In other words, 1 m³/min of continuous air demand costs roughly 3,000 to 4,500 USD per year at 5,000 hours and 0.10 USD per kWh.
What consumes it in a die casting cell:
- Die spray atomising air. Air-assisted nozzles at 3 to 6 bar can draw significant continuous flow. Lowering atomising pressure to the minimum that gives the droplet size you need is free money; over-atomising wastes air and blows film off adjacent die surfaces.
- Blow-off and part drying. General blast nozzles are usually oversized and left running too long. Directed knife-edge or engineered air nozzles typically cut consumption by 30 to 60 percent while drying faster, which also shortens the cycle.
- Pneumatic actuators, clamps and ejector assist on trim presses and fixtures.
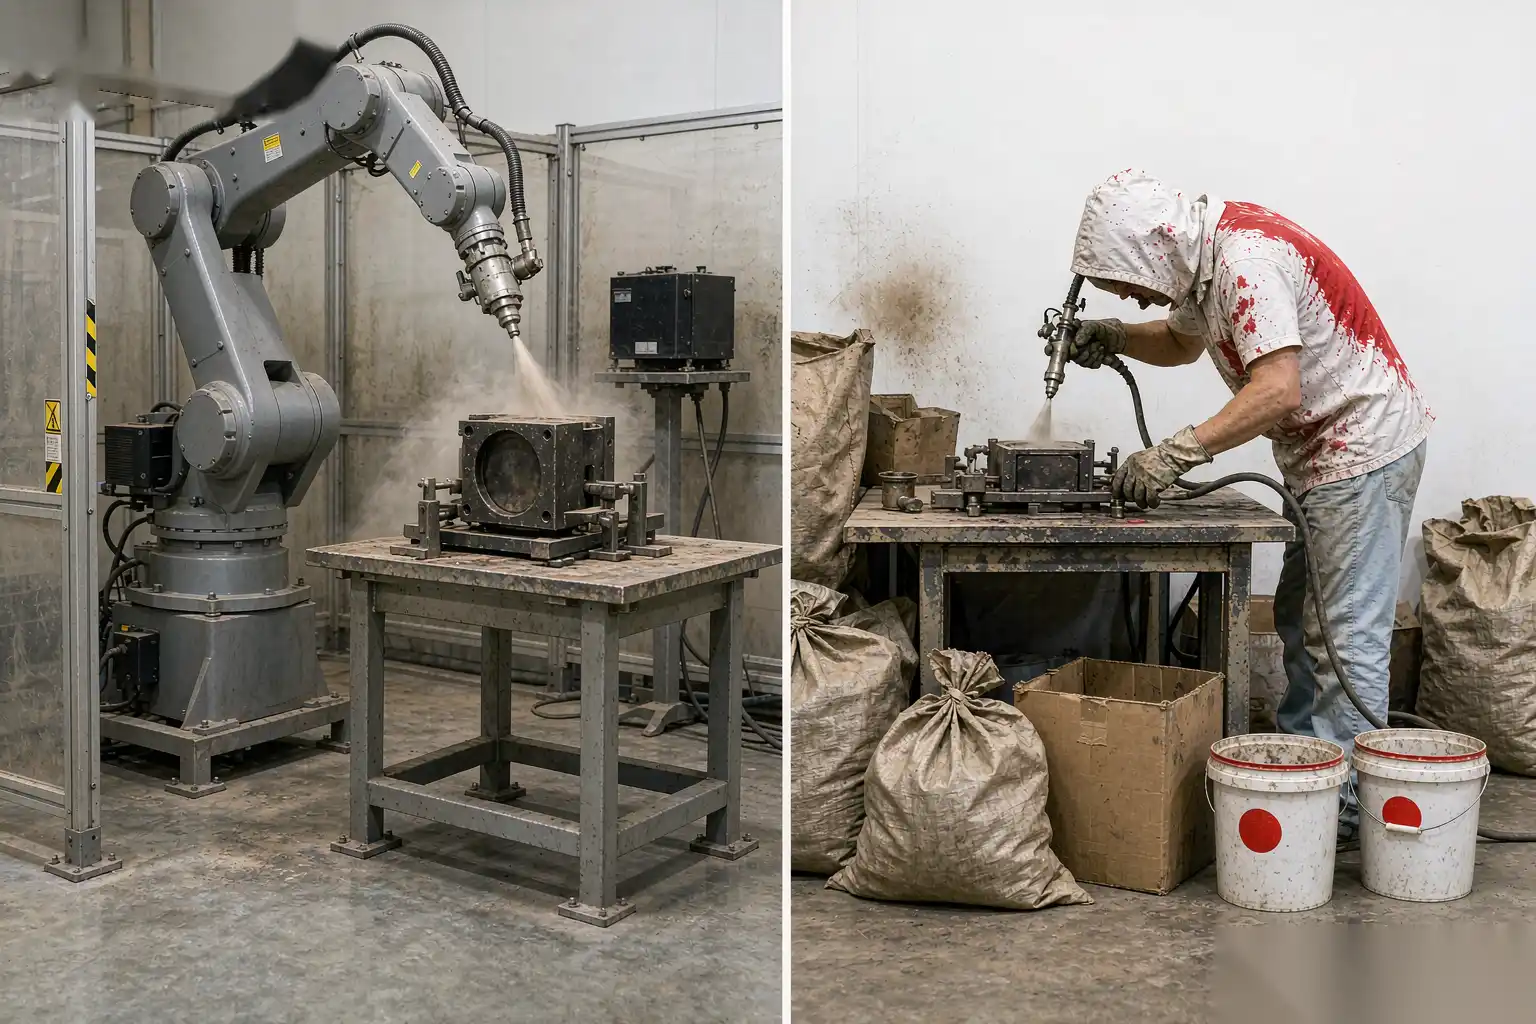
- Pneumatic float spindles and air-driven tools in the grinding and deburring stations. A single pneumatic compliance spindle can draw several hundred litres per minute during contact; electric or mechanical compliance options remove that load entirely. This is a specification decision made at equipment purchase and it lasts fifteen years. Compare technologies before you buy: robotic deburring vs manual deburring which is better covers part of that comparison from the productivity side.
- Leakage. Typically 20 to 40 percent of total production in plants that have not run a leak programme. A 3 mm hole at 7 bar passes roughly 0.6 to 0.9 m³/min of free air, equivalent to 4 to 6 kW continuous, or about 2,000 to 3,000 USD per year from one hole. Multiply by twenty fittings and you have a serious number.
Three interventions with reliable payback:
- Quarterly ultrasonic leak survey followed by repair. Typically 10 to 25 percent of total compressed air energy, usually for a few thousand dollars of contractor time and parts.
- Reduce header pressure. Going from 7.0 to 6.0 bar typically reduces compressor energy by 7 to 10 percent and also reduces leakage flow, because leak flow scales with pressure differential. Verify the lowest-pressure tool or actuator requirement first; setting the header 0.5 to 1.0 bar above the highest genuine requirement is usually enough.
- Fix compressor sequencing and consider variable speed drive. Multiple fixed-speed compressors fighting each other is common. VSD trim machines typically deliver 15 to 30 percent on their portion of the load.
Spray, Cooling Water, Extraction, and Building Services
These are the “everything else” loads, and they are larger than most people expect because they run continuously whether or not you are casting.
| Load | Typical installed | Duty pattern | Comment |
|---|---|---|---|
| Cooling water pumps and tower fans | 15 to 45 kW for a cell group | Continuous during production, often continuous full stop | VFDs on pumps typically save 20 to 40 percent; check actual circuit flow against design before assuming you need the current flow |
| Furnace fume extraction and baghouse fan | 5.5 to 22 kW | Continuous | Damper control interlocked to furnace lid position and work cycle pays for itself quickly |
| Dust collector on grinding, blasting and polishing cells | 7.5 to 30 kW | Continuous during finishing operation | Size correctly and interlock to the cell, not to a generic timer |
| Plant lighting and compressed air drying | Varies | Continuous | Usually allocated by floor area; LED plus occupancy controls are routine but rarely attributed to a cost-reduction project |
| Demand charges | Not energy, but 15 to 35 percent of many industrial power bills | Peak driven | Avoid simultaneous start-up of compressors, extractions and furnaces after a break; stage the restart sequence |
A point worth raising explicitly with finance: demand charges are billed on your highest fifteen-minute consumption in the month, so staggering equipment starts can reduce the bill without reducing a single kilowatt-hour.
Worked Calculation for a Mid-Size Part
A worked example is worth more than any general statement. Assume a two-cavity die producing two 0.9 kg aluminium castings per shot, shot weight 2.4 kg, cycle 42 seconds, 5,000 scheduled machine hours per year, OEE 62 percent.
Derived quantities:
- Theoretical rate: 3,600 / 42 = 85.7 shots per hour, or 171.4 parts per hour
- Good output at 62 percent OEE: 106 parts per hour, or 531,500 parts per year
- Metal melted per good part including process loss: 0.9 × 1.05 = 0.945 kg
- Melting specific energy: 0.75 kWh/kg (electric induction, well run)
- Electricity price: 0.10 USD per kWh
| Cost element | Basis | kWh per part | USD per part | Share of energy |
|---|---|---|---|---|
| Melting | 0.945 kg × 0.75 kWh/kg | 0.710 | 0.0710 | 52.1 percent |
| Holding furnace standby | 12 kW furnace share, 6,500 furnace hours per year | 0.147 | 0.0147 | 10.8 percent |
| Machine drive | 22 kW average draw, 42 s per shot, two parts per shot | 0.128 | 0.0128 | 9.4 percent |
| Trim press and conveyors | 4 kW average allocated to the cell | 0.038 | 0.0038 | 2.8 percent |
| Compressed air | 16 kW continuous equivalent including leaks, 5,000 hours | 0.151 | 0.0151 | 11.1 percent |
| Cooling water pumps and tower | 6 kW continuous equivalent, 5,000 hours | 0.056 | 0.0056 | 4.1 percent |
| Fume and dust extraction fans | 9 kW continuous equivalent, 5,000 hours | 0.085 | 0.0085 | 6.2 percent |
| Lighting and building services | 5 kW allocated, 5,000 hours | 0.047 | 0.0047 | 3.5 percent |
| Total | 1.362 | 0.136 | 100 percent |
The result is about 1.36 kWh and 0.136 USD per good part, or 0.15 USD per kilogram of casting shipped. Express it both ways, because kWh per tonne of metal poured is how the melting department will manage it and cost per part is how sales will use it.
Sensitivity worth knowing before anyone argues about the details: a 20 percent change in melting efficiency moves the total by about 10 percent, while eliminating compressed air leakage and cutting header pressure by one bar moves it by roughly 2 to 4 percent. Melting dominates the total but offers the smallest percentage improvement per dollar spent; air offers the best.
Energy Against Material and Labour
Honest context prevents embarrassment later. Using the same part:
| Cost element | Basis | USD per part | Share of total |
|---|---|---|---|
| Metal | 0.945 kg at 2.30 USD/kg | 2.174 | 61.1 percent |
| Tooling amortisation | Die to 150,000 shots at 45,000 USD, two cavities | 0.150 | 4.2 percent |
| Consumables: lubricant, filters, media, abrasive belts, flux | Measured consumption | 0.180 | 5.1 percent |
| Machine and cell depreciation | Included in the allocated overhead line | 0.850 | 23.9 percent |
| Energy | From the table above | 0.136 | 3.8 percent |
| Direct labour | 1.5 operators at 6.50 USD per hour, 106 good parts per hour | 0.092 | 2.6 percent |
| Total | 3.582 | 100 percent |
Energy is therefore roughly 4 percent of total part cost, but roughly 10 percent of conversion cost once material is excluded. It sits below tooling in absolute terms, which is the argument to make when someone asks whether this work is worth doing: yes, and it is worth doing because unlike metal price it is controllable, and unlike tooling it improves every month you attend to it.
Reduction Measures, Expected Savings, and Building the Model
Realistic expectations, with the ranges you should quote rather than best-case numbers:
| Measure | Expected saving on that load | Typical payback | Maturity |
|---|---|---|---|
| Ultrasonic leak survey and repair | 10 to 25 percent of compressed air energy | 3 to 8 months | Immediately actionable |
| Header pressure reduction of 1 bar | 7 to 10 percent of compressor energy, plus reduced leakage | Immediate to 2 months | Immediately actionable, verify tool requirements first |
| VSD compressor trim plus corrected sequencing | 15 to 30 percent of compressed air energy | 12 to 24 months | Standard project |
| Hot or warm returns returned to the holding furnace | 20 to 40 percent of melting energy on the returned fraction | 6 to 18 months | Layout dependent |
| Holding setpoint discipline and insulation repair | 5 to 15 percent of holding losses | Under 6 months | Immediately actionable |
| Weekend and stoppage setback policy | Up to 3,000 to 4,000 USD per furnace per year | Immediate | Policy change plus restart procedure |
| Machine hydraulic upgrade or variable pump conversion | 30 to 60 percent of machine energy | 12 to 36 months | Capital project |
| VFDs on cooling pumps and extraction fans | 20 to 40 percent of those loads | 12 to 24 months | Standard project |
| Oxidation loss reduction from 4 to 2 percent | Equivalent to roughly 0.045 USD per kg shipped | Under 6 months | Often overlooked, larger than most energy items |
| Recuperative burners on gas furnaces | 10 to 25 percent of melting fuel | 12 to 30 months | Capital project |
How to structure the model so that finance accepts it:
- Sub-meter the real things. One meter on the melting department, one on the machine group, one on the compressed air system, one on the finishing cells, plus the whole-plant main meter. Everything else is estimation, and estimation is what finance distrusts.
- Use three allocation rules and write them down. Melting allocated by tonnes poured from meter data; machine and cell energy allocated by metered or calculated kWh per machine-hour; shared services allocated by floor area with demand charges allocated by coincident peak contribution. Consistency matters more than theoretical purity.
- Separate fixed from variable. Melting and machine cycle energy vary with output. Holding losses, building services and much compressed air are largely fixed. Pricing decisions should use variable cost, and full-absorption costing should use both, but mixing them up will make every subsequent argument wrong.
- Reconcile to the main meter monthly. If the sum of your allocated consumption does not match the utility meter within roughly 10 percent, the model is not yet credible. Publish the reconciliation rather than hiding it.
- Freeze a metered baseline before any project starts, signed off by production and finance together, stated as kWh per tonne poured and kWh per good part. That single discipline eliminates most disputes about whether savings were real.
- Track a rolling twelve months. Summer cooling load and winter furnace efficiency changes are real, and a single month comparison will mislead.
Equipment specification decisions made years ago are still in these numbers. DZ Machinery supplies robotic deburring, grinding and polishing cells using electric spindles with mechanical or pneumatic compliance options, and we routinely quote air consumption per cell alongside cycle time and floor space so it can go into the same model as everything else; see our automated surface finishing equipment range for the configurations we build. If you want cell-level energy input data for the finishing station before you specify it, send us your part drawings and target hourly output.