

QUICK FACTS
| Cell footprint | 2.5–6 m² |
| Changeover | <15 min between SKUs |
| Media life | 60–180 parts/belt |
What Automated Finishing Quality Control Means
Automated finishing quality control is the practice of measuring surface results directly on the production line, using sensors and software instead of manual inspection alone. A robotic cell can repeat a path precisely, but only measurement tells you whether the part actually meets spec. Therefore, quality control becomes the feedback loop that keeps the process honest.
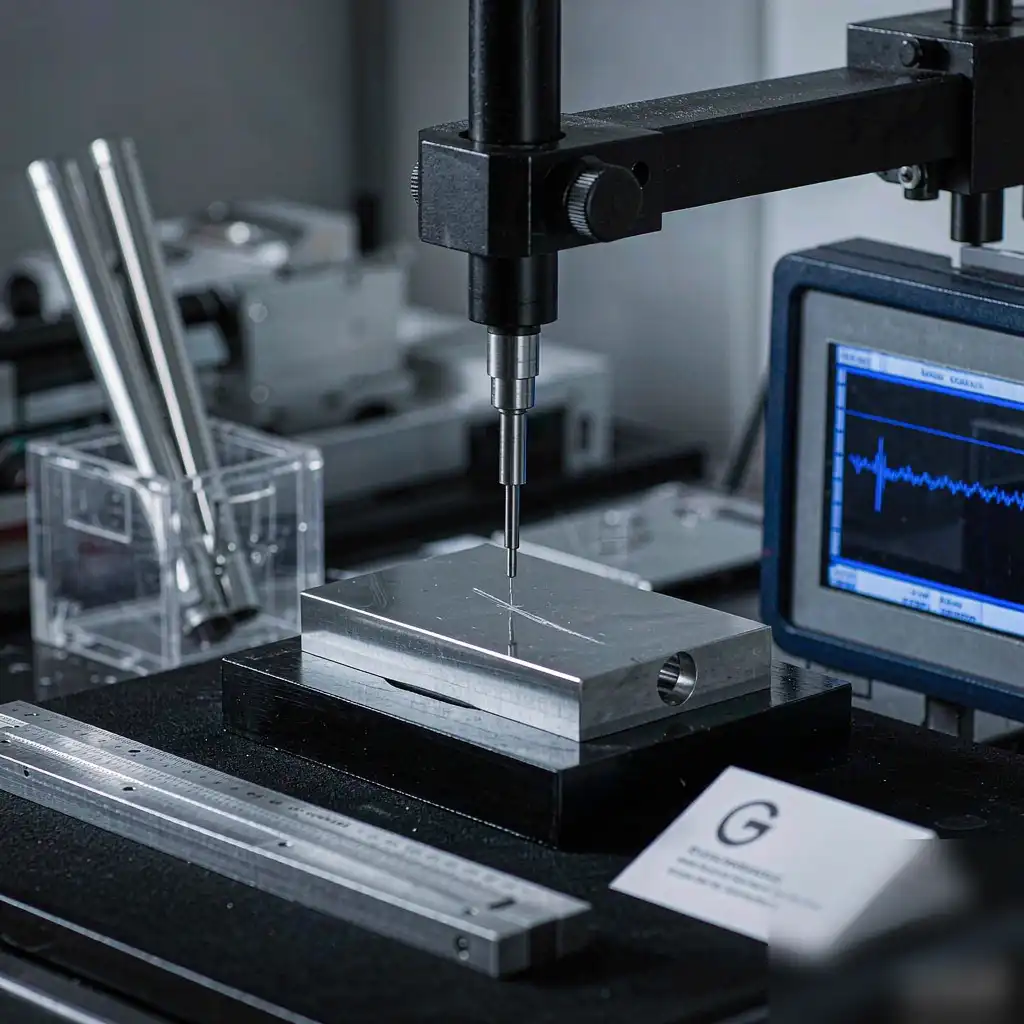
Many plants still rely on visual checks and feeler gauges after the cell stops. However, that approach hides variation until it becomes scrap. By contrast, instrumented measurement catches drift early and protects both throughput and yield at the same time.
Why Measurement Belongs Inside the Cell
Traditional post-process inspection measures a small sample and reports the average. Consequently, the worst parts slip through while good parts get over-polished. Integrated measurement changes this by checking every part at the point of finishing.
When you measure inside the cell, you reduce handling and rework. Moreover, the data feeds the controller so the next part improves automatically. This is the core advantage of metal finishing automation to reduce costs and improve quality, where closed-loop data turns finishing from a craft into a controlled process.
Stage 1: Incoming Part Verification
Quality control begins before the robot moves. First, you verify the raw casting or blank against its baseline geometry. Laser scanners or fixture probes confirm the part sits within tolerance and locates correctly in the fixture.
If the incoming part is out of range, the cell should flag it and pause. Otherwise, the robot will compensate for a defect it cannot fix. This early gate prevents wasted cycles and protects the accuracy of all downstream measurement.
Stage 2: In-Process Force and Torque Sensing
During finishing, the robot should sense how hard it pushes. Force-torque sensors detect when a belt loads up or a part resists more than expected. Then the controller can adjust speed or pressure in real time without stopping the run.
This signal is a leading indicator of quality. Specifically, a rising force trend often means the abrasive is dulling before the surface looks wrong. Tracking it gives you a warning hours before scrap appears on the inspection bench.
Stage 3: In-Line Surface Roughness Measurement
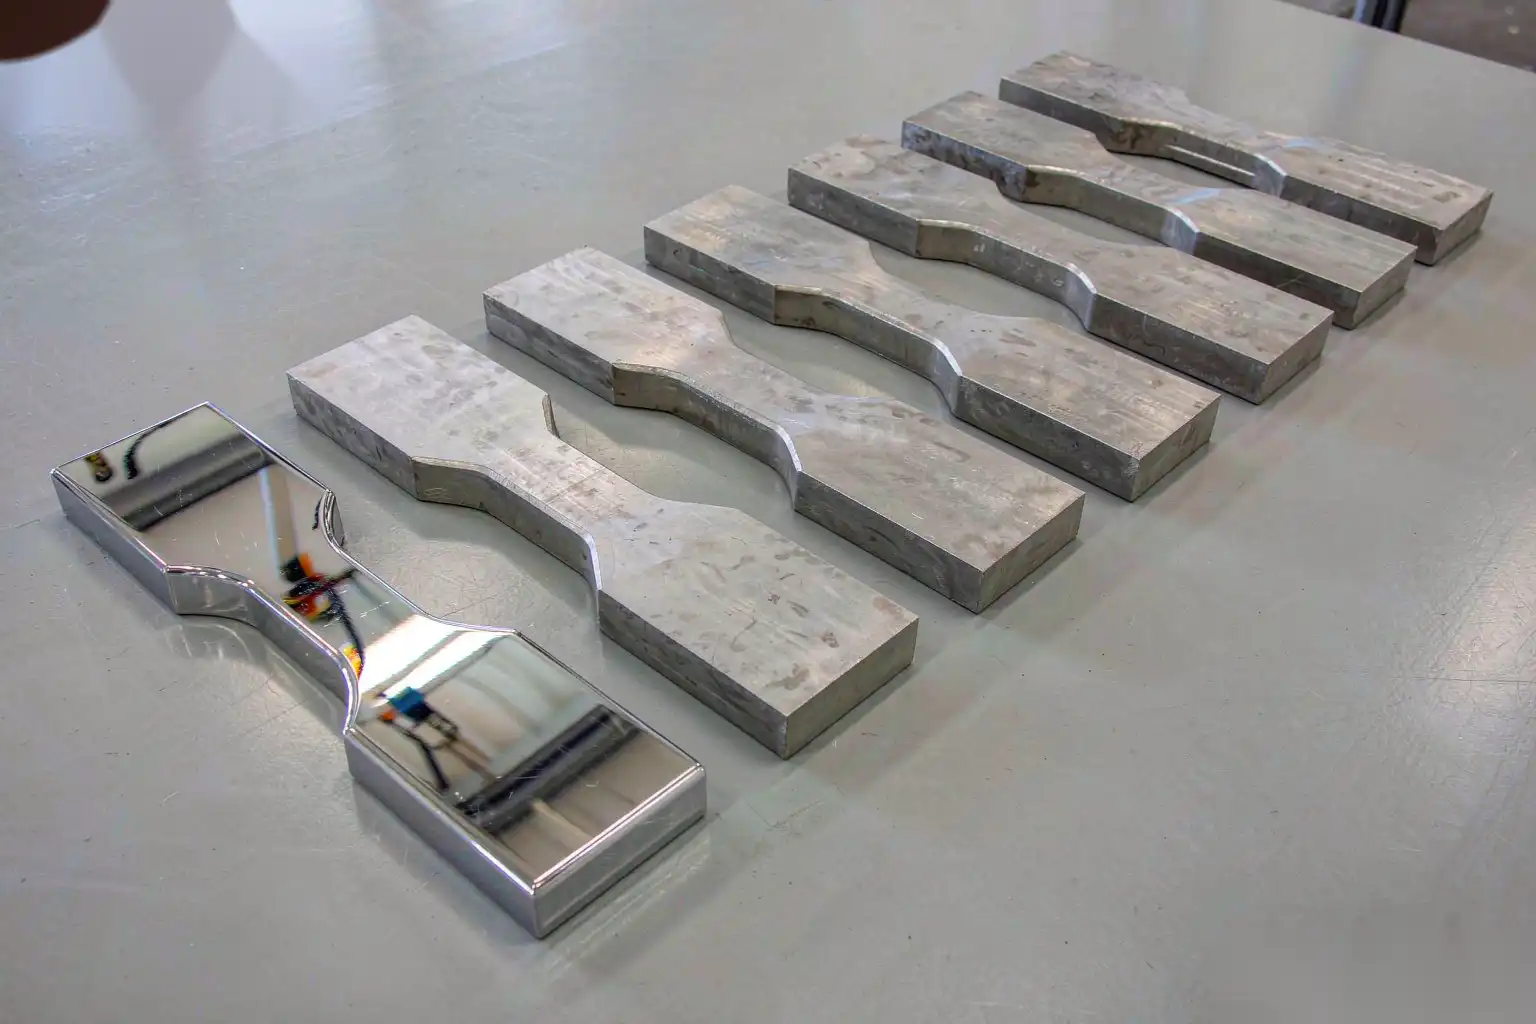
Surface roughness, expressed as Ra or Rz, is the most direct finishing metric. Modern optical profilometers measure it without touching the part. As a result, you get a number on every part instead of a guess on a small sample.
Set the target band and let the software sort parts automatically. Furthermore, store each reading with the part serial so you can trace any complaint back to its exact run. Traceability turns quality from an opinion into a permanent record that customers trust.
Stage 4: Geometry and Edge Break Verification
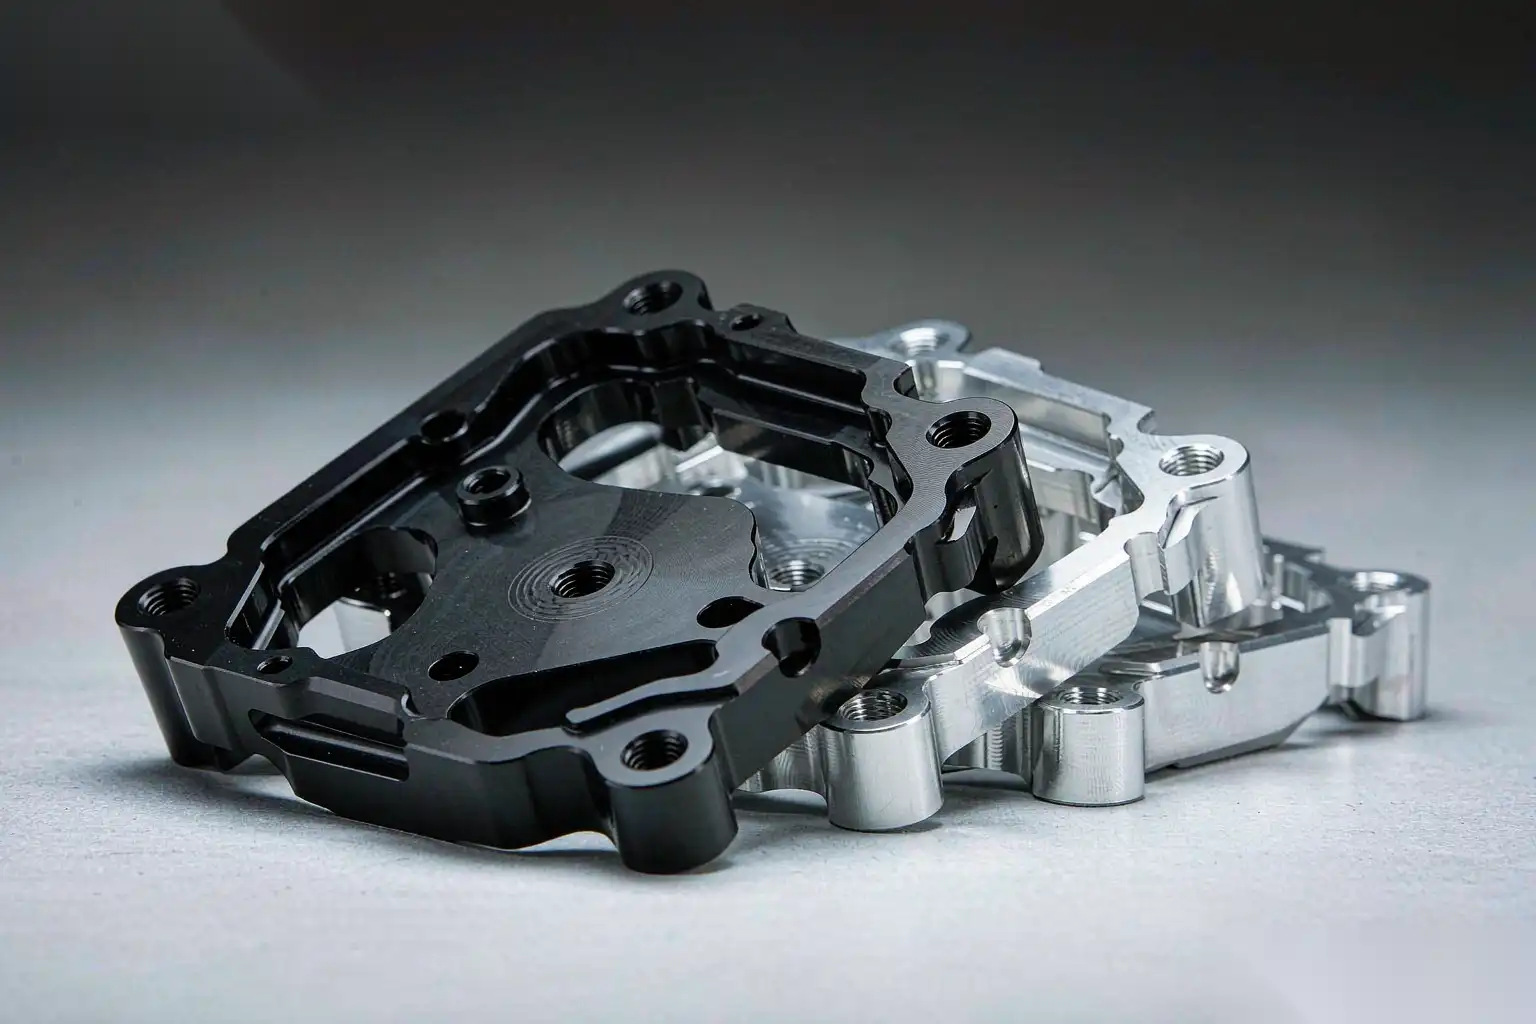
Finishing changes more than texture; it also changes edges and contours. A vision system checks that radii, chamfers, and blend lines match the CAD model. Thus, you confirm the part is both smooth and correctly shaped at once.
Edge break is especially important for safety and coating adhesion. In addition, automated vision removes the inconsistency of human judgment between shifts. The standard stays the same at 6 a.m. and 6 p.m., which matters for audited contracts.
Stage 5: Post-Process Audit and Sampling
Even with in-line checks, a periodic audit confirms the system has not drifted. A dedicated metrology station re-measures a statistical sample each shift. Meanwhile, the audit validates the inline sensors themselves against a reference standard.
Use the audit to recalibrate and to catch slow trends. For example, a gradual Ra creep may indicate environmental changes rather than tool wear. The audit closes the loop on the loop and keeps trust in the live data.
Key Metrics You Should Track
Measurement only helps if you track the right numbers. The table below lists the core metrics, how to measure them, and a realistic target for a controlled robotic cell running production parts. We have seen plants succeed with as few as three active metrics, so do not let the full list intimidate you at the start.
| Metric | Measurement Method | Typical Target |
|---|---|---|
| Surface roughness Ra | Optical or contact profilometer, in-line | Within ±10% of spec band |
| Edge break radius | Vision system vs CAD model | 0.2–0.5 mm as designed |
| First-pass yield | MES count of in-spec parts | ≥ 98% |
| Force variation | Force-torque sensor logging | σ below 5% of setpoint |
| Rework rate | Cell history per shift | ≤ 2% |
Choose two or three metrics as your daily dashboard. Then add the rest as deeper diagnostic signals when something looks wrong or a customer asks for evidence.
Setting Realistic Targets and Tolerances
Targets must come from the customer spec, not from what the cell happens to produce. First, define the acceptable Ra band and the allowed edge range from the drawing. Next, set the control limits tighter than the spec so you have room to react before failure.
A common mistake is setting the target exactly at the spec edge. Instead, center your process and watch the spread of results over a full shift. Consequently, normal variation stays well inside the limit and expensive surprises become rare events rather than daily ones.
Tools That Make Measurement Practical
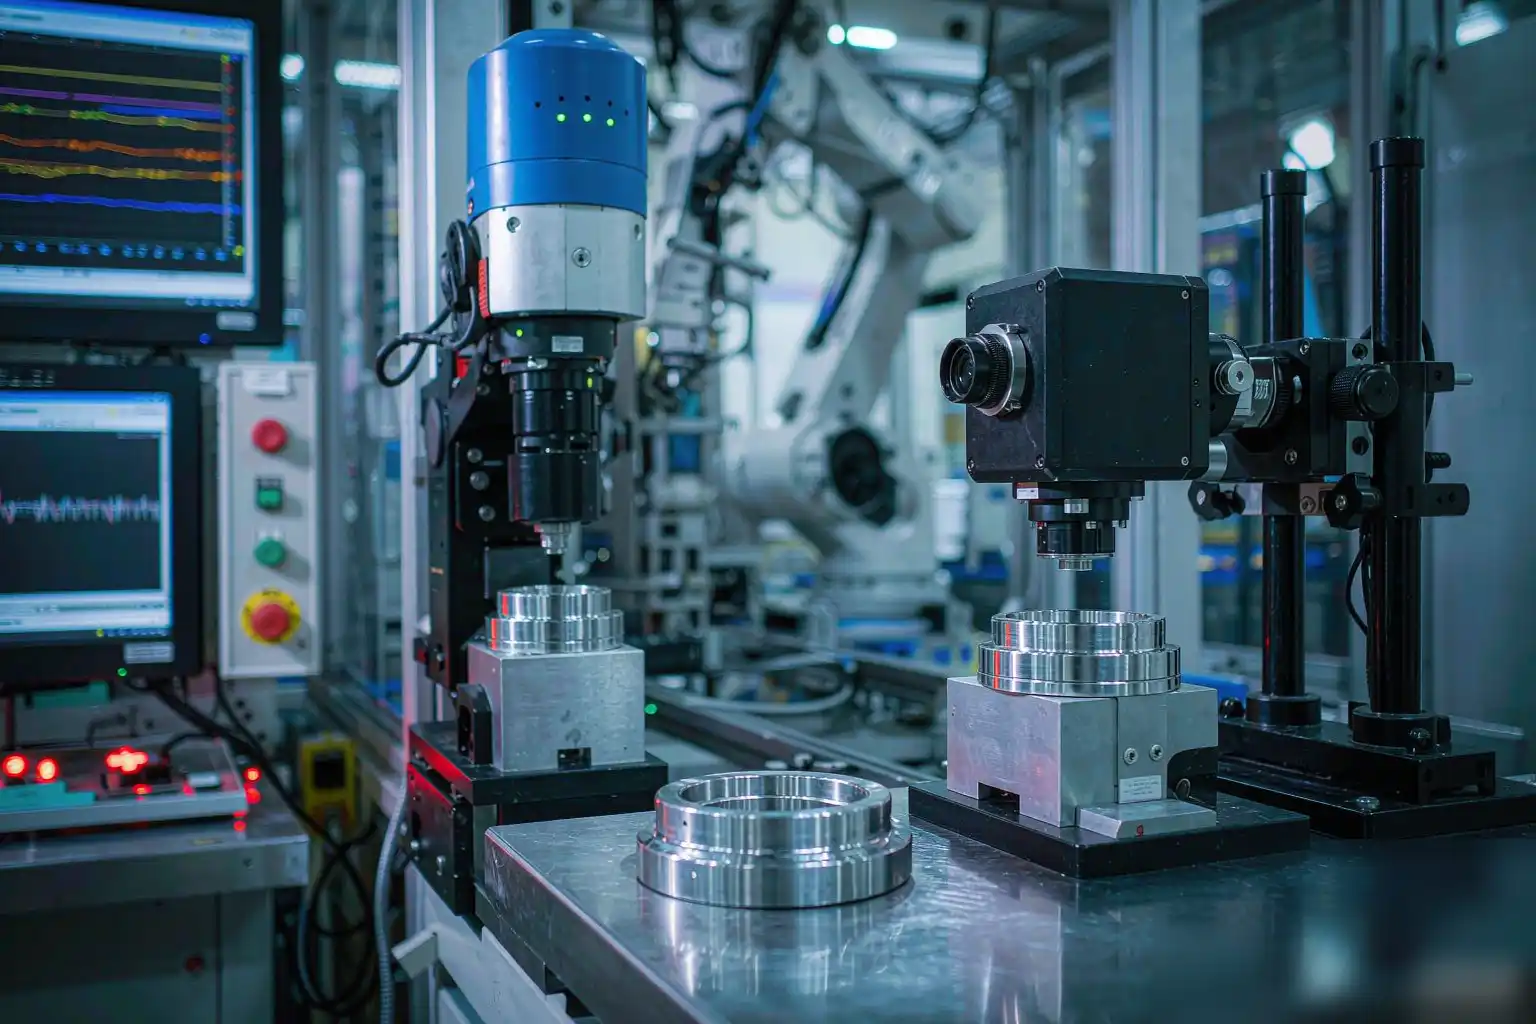
You do not need a lab to measure well. A compact laser scanner, a force sensor, and a vision camera cover most finishing cells. These tools mount on the robot or beside the fixture with minimal footprint and modest cost.
Software is the real multiplier because it aggregates every signal into one view. The essential building blocks are straightforward:
- Non-contact profilometer for roughness on curved and flat surfaces.
- Force-torque sensor mounted at the wrist for live load feedback.
- Machine vision for edge, geometry, and defect detection.
- Cell controller or MES link to store and act on the data.
Because the platform aggregates every signal, it shows trends you would never see by hand. The data becomes the difference between hoping and knowing with confidence.
Building a Closed-Loop Feedback System
Measurement reaches full value only when it changes the process. The controller should receive the roughness and force data and adjust parameters for the next part. Therefore, each part teaches the cell to do better than the last.
Start with simple rules, such as lowering speed when force rises above a threshold. Then expand to model-based correction as confidence grows and data accumulates. Over time, the cell self-corrects and operators shift to calm oversight instead of firefighting.
Common Measurement Mistakes to Avoid
Many programs fail not from bad robots but from bad measurement habits. One error is sampling too rarely to see the variation that actually exists. Another is trusting a sensor that was never calibrated against a certified reference part.
A third mistake is ignoring the data after collecting it. Specifically, a dashboard nobody reads is worse than no dashboard at all. Make the numbers trigger action, or do not bother capturing them in the first place.
How Foundries Benefit From In-Line Control
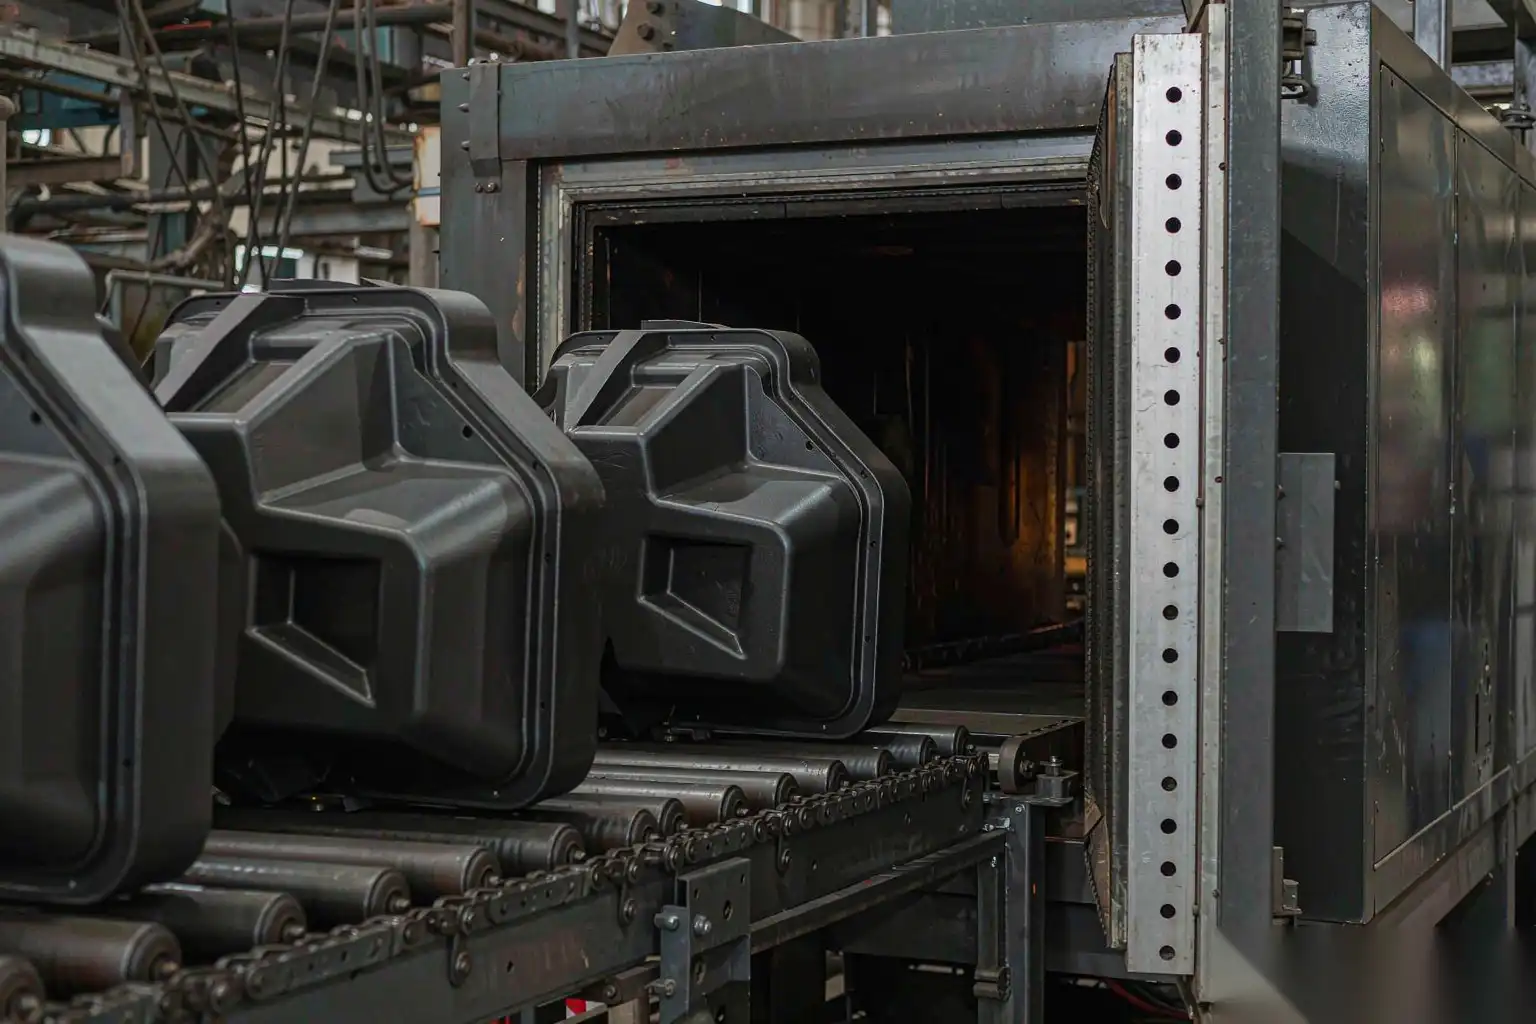
Foundries face rough, variable castings that punish fixed recipes. Automated measurement lets the cell adapt to each part’s starting condition before it touches the surface. Hence, the same program finishes clean and dirty castings alike without manual sorting.
This adaptability is why more plants are adopting guided systems on the shop floor. You can read our surface finishing automation guide for foundries to see how measurement fits a casting workflow from knock-out through final inspection.
Where AI and Robotics Raise the Ceiling
Adding intelligence moves control from reactive to predictive. Machine learning models spot patterns in roughness, force, and tool wear long before a failure occurs. Thus, the cell schedules its own maintenance window instead of waiting for a breakdown.
Robotics handles the physical repeatability while AI handles the judgment behind adjustments. Together they deliver a level of consistency manual finishing cannot match at volume. Explore smart surface finishing with AI and robotics for a deeper look at this combined stack.
Implementing a Measurement Plan in 30 Days
You can stand up basic control quickly with a phased approach. Begin by adding force sensing and one roughness check on a single cell that runs your hardest part. Then review the data for two weeks to learn your real variation rather than your assumed variation. Keep the pilot small so a setback stays cheap and the lesson stays clear for the rest of the plant.
After that, layer in vision and closed-loop rules once the baseline is stable. Finally, roll the template to other cells once the first one proves reliable across a full month. Small steps build the habit faster than a big-bang launch that nobody trusts.
Reporting and the Final Checklist
Measurement is only useful when shared with the people who can act. Send daily yield and roughness summaries to the quality team and the line supervisors every morning. Consequently, problems get owned instead of ignored until the monthly review.
Before you declare automated finishing quality control successful, confirm a few essentials. First, every part carries a measured record tied to its serial. Second, the control limits sit inside the customer spec with margin. Third, the data triggers automatic correction, not just reports. Finally, your team reviews trends on a fixed schedule so improvement becomes the default culture.
KEY METRIC — Track first-pass yield above 98% and rework below 2%; these two numbers summarize the health of your entire finishing cell at a glance.
ROI SIGNAL — Plants that close the measurement loop typically cut scrap by double digits within the first quarter, because variation is caught at the source rather than at final inspection.
Consult your quality team before changing an approved process.